
As of 05/13/2024
Indus: 39,432 -81.33 -0.2%
Trans: 15,629 +31.37 +0.2%
Utils: 941 -1.34 -0.1%
Nasdaq: 16,388 +47.37 +0.3%
S&P 500: 5,221 -1.26 0.0%
|
YTD
+4.6%
-1.7%
+6.7%
+9.2%
+9.5%
|
|
As of 05/13/2024
Indus: 39,432 -81.33 -0.2%
Trans: 15,629 +31.37 +0.2%
Utils: 941 -1.34 -0.1%
Nasdaq: 16,388 +47.37 +0.3%
S&P 500: 5,221 -1.26 0.0%
|
YTD
+4.6%
-1.7%
+6.7%
+9.2%
+9.5%
| |
|
| ||
Recent Headlines |


|
Older Headlines
|
Archives |
$ $ $
I show another slider trading quiz featuring horn tops.
$ $ $
Here's a symbol list of 182 chart and candlestick patterns (13 "investment grade" candle patterns) found in today's securities using my version of Patternz: ABT, ACN, ADTN, ALKS, ALL, AMED, AEO, AXP, AFG, AMWD, APA, APOG, ADM, AWI, ARW, ASH, AIZ, ATO, ADSK, BCPC, BAX, BA, BAH, BRC, BG, CDNS, COR, CDAY, CINF, CTAS, CSCO, CLF, CLX, CNA, CNO, CTSH, CMCO, CXW, COST, CMI, DVN, FANG, DFS, DSGR, ^DJI, EXP, WIRE, EVH, FICO, FAST, FIS, FE, FMC, GME, GPRO, GFF, HBI, THG, HLIT, HSY, HON, DHI, HWM, HUM, JBHT, HURC, INCY, NSP, IBP, IIIN, PODD, TILE, IPG, INTU, ISRG, IRM, JKHY, JBLU, KALU, KEYS, LZB, LH, LRCX, LANC, LDOS, MGY, MANH, MAS, MA, MTDR, MTRN, MDT, MLI, MYGN, NFG, NOV, JWN, NUS, OXY, ORI, OMC, ASGN, PKE, PEN, PETS, PLXS, PG, PGR, PRU, PEG, PHM, QTWO, RRC, RTX, RLI, ROK, ROP, RGLD, R, SAND, SCHW, SEE, SEIC, SMTC, SWN, SXI, TDY, TPX, TOL, TDG, TZOO, TG, UPS, MDRX, VRTX, V, VMC, WMT, WU, WLK, WSC, WWW, WWD, FDN, FXI, IYZ, IYF, ITB, EWK, EEM, EWG, EWH, EWM, EWW, EWL, TUR, PHO, XLF, XLV, XLB, XRT, VAW. Click this link for details (pattern type, start and end dates).
For a list of small patterns (those a few days wide) click this link.
$ $ $
The following table shows where Fibonacci retrace values of the day's high-low range are plus pivot points, calculated on the Dow industrials, sorted by value. When several are near each other (small differences), the area might act as support or resistance.
-- Thomas Bulkowski, author: Invest for Two-Comma Wealth and Training "Miles" (#Ad) ![]()
![]()
| © 2024 ThePatternSite.com Metric | Value | Diff | Close (within 10% of the high-low range for the day)? |
| Monthly S2 | 36,906.00 | ||
| Monthly S1 | 38,168.75 | 1,262.76 | |
| Weekly S2 | 38,343.09 | 174.34 | |
| Monthly Pivot | 38,874.32 | 531.23 | |
| Weekly S1 | 38,887.30 | 12.98 | Yes! The Weekly S1 is close to the Monthly Pivot. |
| Weekly Pivot | 39,233.59 | 346.29 | |
| Daily S2 | 39,249.64 | 16.05 | Yes! The Daily S2 is close to the Weekly Pivot. |
| Daily S1 | 39,340.58 | 90.93 | |
| Low | 39,403.05 | 62.47 | |
| Close | 39,431.51 | 28.46 | |
| Daily Pivot | 39,493.98 | 62.47 | |
| 61.8% Down from Intraday High | 39,496.39 | 2.40 | Yes! The 61.8% Down from Intraday High is close to the Daily Pivot. |
| 50% Down from Intraday High | 39,525.22 | 28.83 | |
| 38.2% Down from Intraday High | 39,554.05 | 28.83 | |
| Daily R1 | 39,584.92 | 30.87 | |
| Open | 39,591.28 | 6.36 | Yes! The Open is close to the Daily R1. |
| High | 39,647.39 | 56.11 | |
| Daily R2 | 39,738.32 | 90.93 | |
| Weekly R1 | 39,777.80 | 39.48 | |
| Weekly R2 | 40,124.09 | 346.29 | |
| Monthly R1 | 40,137.07 | 12.98 | Yes! The Monthly R1 is close to the Weekly R2. |
| Monthly R2 | 40,842.64 | 705.56 |
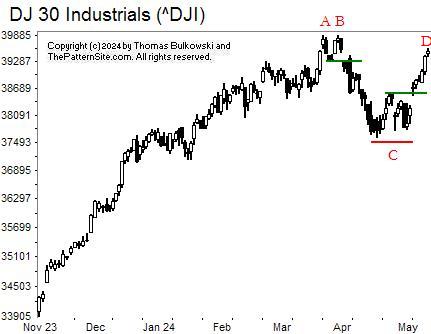
At AB is a chart pattern called a double top. It confirms as a valid chart pattern when the index closes below the horizontal green line.
At C, we see another chart pattern and another green line. The pattern is a weird looking triple bottom. The three valleys should bottom near the same price, but in this case, they don't.
A close above the nearby green line confirms the chart pattern as valid and signals an upward move, which sees price rise to D.
At D, we see the index getting near the price level of peaks A and B. That's important because it signals overhead resistance is coming. That could stop the upward move (and my guess is it will).
$ $ $
I released a new version of Patternz. It has a button on the Chart form where you can get more detail about a found chart pattern.
$ $ $
I had one reader of my Training "Miles" book (pictured on the right) write, "It did not disappoint. I read the entire book in one sitting." -- DJB
$ $ $
![]()
The following is a brief review of how the markets performed over time. The numbers refer to the close-to-close move in the Dow industrials.
Many options expire this week, so traders will be looking to close out their positions, and that suggests increased volatility (large daily price swings).
![]()
The following is based on an SFO article in December 2004 by John Seekinger, titled, "Take a two-dimensional approach." He offers these tips.
| Index | S2 | S1 | Pivot | R1 | R2 |
| Dow Industrials (^DJI): Daily | 39,326 | 39,419 | 39,500 | 39,593 | 39,673 |
| Weekly | 38,370 | 38,942 | 39,261 | 39,832 | 40,151 |
| Monthly | 36,933 | 38,223 | 38,901 | 40,191 | 40,870 |
| S&P500 (^GSPC): Daily | 5,194 | 5,208 | 5,224 | 5,238 | 5,254 |
| Weekly | 5,104 | 5,164 | 5,202 | 5,261 | 5,299 |
| Monthly | 4,853 | 5,038 | 5,139 | 5,324 | 5,425 |
| Nasdaq (^IXIC): Daily | 16,213 | 16,277 | 16,357 | 16,421 | 16,501 |
| Weekly | 16,086 | 16,213 | 16,325 | 16,453 | 16,565 |
| Monthly | 14,768 | 15,554 | 16,009 | 16,796 | 17,251 |
Here are the formulas:
![]()
Earnings season is either underway or should be starting soon. The sessions could be more volatile.
Here's a symbol list of 172 chart and candlestick patterns (13 "investment grade" candle patterns) found in today's securities using my version of Patternz: MMM, ABM, ADTN, AFL, AKAM, ALB, AMED, AXP, AFG, AR, APA, AMAT, ATR, ACGL, ANET, AIZ, ATO, ADSK, AVY, BCPC, BZH, BA, BOOT, BAH, BRC, BMY, BBW, CALM, CAL, CE, CRL, CHKP, CINF, CTAS, CLX, CNO, CNX, CONN, CRH, CMI, DVN, FANG, ^DJI, DRQ, DTE, EOG, EVH, FICO, FE, FLS, FRD, GME, GIS, GPN, GPRO, GFF, GES, HBI, HLIT, HIG, HE, HAYN, HQY, HELE, HSY, HOV, HWM, INCY, PODD, INTC, IPAR, IPI, JAZZ, KALU, KMT, KEYS, LH, MGY, MRO, MTDR, MRCY, MU, MOS, MUR, ^IXIC, NFG, NOV, NWL, NI, OXY, OLN, OMC, ON, PYPL, PETS, PPG, PEG, QTWO, KWR, DGX, RRC, RGA, RES, SAND, SIGI, STR, SWX, SWN, SCS, TPX, TTD, TDG, TZOO, UHAL, SLCA, UIS, VFC, VLO, V, VMC, WAT, WOLF, WWD, ITA, IYM, IHE, FXI, QQQ, IYH, IEV, MXI, ILF, IEO, IYF, EWO, EWK, EWC, EEM, EWG, EWH, EWI, EWM, EPP, EZA, EWY, EWP, EWD, EWL, EWT, TUR, EWU, PBE, PHO, XLF, XLV, XLB, USO, SMH, VAW, MGK. Click this link for details (pattern type, start and end dates).
For a list of small patterns (those a few days wide) click this link.
The below industries were the best (rank 1) or worst performing of those I follow.
|
-- Thomas Bulkowski, author: Invest for Two-Comma Wealth and Training "Miles" (#Ad) ![]()
![]()
$ $ $
Here's a symbol list of 132 chart and candlestick patterns (13 "investment grade" candle patterns) found in today's securities using my version of Patternz: AXDX, ADTN, AFL, ATSG, AEE, AFG, AAPL, ATR, ARW, ADSK, BCPC, BSET, BBY, BKH, BCO, BRKR, BBW, BLDR, CACI, CALM, CPB, CE, CLS, COR, CRL, CHKP, CINF, CTAS, CNO, CGNX, CMTL, CONN, CXW, DUK, BOOM, WIRE, EPAM, EQT, EXC, FDS, FDX, FWRD, FRD, GME, GNW, GILD, HIG, HQY, HELE, HUBG, ITW, INCY, INFN, IPG, INTU, K, KMT, KFRC, LHX, LZB, LAMR, LEG, LMT, LOW, MGEE, NFG, NEE, NWPX, NOVT, NTNX, NVDA, OMCL, PKE, PTEN, POR, PG, DGX, RL, RRC, ROP, ROST, SAND, SMTC, SHOP, STR, SCCO, SWX, SWN, TRV, TZOO, UIS, UPS, UNH, UNM, VRTX, V, WRB, WU, WPM, WDAY, XEL, IYE, FXL, IHF, IEV, IXC, MXI, SLV, IGE, IHI, EWA, EWO, EWK, EWQ, EWG, EWI, EWD, EWL, PXJ, PJP, XLE, XLB, VIS, VAW. Click this link for details (pattern type, start and end dates).
For a list of small patterns (those a few days wide) click this link.
$ $ $
You can find setups based on a Fibonacci retrace by clicking on the link.
The following patterns were found manually, not using Patternz. Mr. Bulkowski has excluded any securities he owns from appearing in the list. However, he may add any of the securities listed to his portfolio at any time, just as you can.
In the table below, the red and green colors are based on the historical breakout direction for the associated chart pattern. If a high and tight flag appears, the start and end dates highlight the flagpole only and not the flag.
For details about the chart patterns, click here.
-- Thomas Bulkowski, author: Invest for Two-Comma Wealth and Training "Miles" (#Ad) ![]()
![]()
| Symbol | Chart Pattern | Bullish Bearish | Start | End | Industry |
| DDD | Big W | 04/18/2024 | 05/01/2024 | Electronics | |
| AYI | Double Bottom, Adam and Adam | 04/19/2024 | 05/02/2024 | Furn/Home Furnishings | |
| ADBE | Triple bottom | 04/22/2024 | 05/01/2024 | Computer Software and Svcs | |
| AEIS | Double Bottom, Adam and Adam | 04/19/2024 | 05/02/2024 | Semiconductor | |
| ALB | Pipe bottom | 04/15/2024 | 04/22/2024 | Chemical (Diversified) | |
| ALKS | Diamond bottom | 04/17/2024 | 05/09/2024 | Drug | |
| AGO | Double Bottom, Eve and Eve | 04/18/2024 | 05/01/2024 | Insurance (Life) | |
| BCPC | Pipe bottom | 04/22/2024 | 04/29/2024 | Chemical (Specialty) | |
| BLDR | Dead-cat bounce | 05/07/2024 | 05/07/2024 | Retail Building Supply | |
| CBT | Triple bottom | 04/19/2024 | 04/30/2024 | Chemical (Diversified) | |
| CNC | Double Bottom, Adam and Adam | 04/12/2024 | 05/01/2024 | Medical Services | |
| CIEN | Pipe bottom | 04/15/2024 | 04/22/2024 | Telecom. Equipment | |
| CGNX | Pipe bottom | 04/15/2024 | 04/22/2024 | Precision Instrument | |
| COTY | Double Top, Adam and Adam | 04/23/2024 | 05/06/2024 | Toiletries/Cosmetics | |
| DECK | Triple bottom | 04/10/2024 | 04/25/2024 | Shoe | |
| EXP | Pipe bottom | 04/15/2024 | 04/22/2024 | Cement and Aggregates | |
| EME | Pipe bottom | 04/15/2024 | 04/22/2024 | Industrial Services | |
| EPAM | Dead-cat bounce | 05/09/2024 | 05/09/2024 | IT Services | |
| EG | Double Bottom, Adam and Adam | 04/17/2024 | 04/30/2024 | Insurance (Prop/Casualty) | |
| FORM | Pipe bottom | 04/15/2024 | 04/22/2024 | Semiconductor | |
| FWRD | Dead-cat bounce | 05/09/2024 | 05/09/2024 | Trucking/Transp. Leasing | |
| GPS | Double Bottom, Adam and Adam | 04/25/2024 | 05/01/2024 | Apparel | |
| HSII | Triple bottom | 04/19/2024 | 05/08/2024 | Human Resources | |
| HNI | Double Bottom, Eve and Eve | 04/16/2024 | 04/29/2024 | Furn/Home Furnishings | |
| HD | Head-and-shoulders bottom | 04/18/2024 | 05/01/2024 | Retail Building Supply | |
| HON | Double Bottom, Eve and Adam | 04/17/2024 | 04/26/2024 | Aerospace/Defense | |
| HOV | Pipe bottom | 04/15/2024 | 04/22/2024 | Homebuilding | |
| IDXX | Diamond bottom | 04/19/2024 | 05/08/2024 | Drug | |
| IBP | Pipe bottom | 04/15/2024 | 04/22/2024 | Retail Building Supply | |
| IIIN | Diamond bottom | 04/16/2024 | 05/09/2024 | Building Materials | |
| KMT | Triple bottom | 03/19/2024 | 05/01/2024 | Metal Fabricating | |
| KEYS | Triple bottom | 04/22/2024 | 05/02/2024 | Precision Instrument | |
| KLAC | Pipe bottom | 04/15/2024 | 04/22/2024 | Semiconductor Cap Equip. | |
| KLIC | Double Bottom, Adam and Adam | 04/19/2024 | 05/01/2024 | Semiconductor Cap Equip. | |
| LZB | Double Bottom, Eve and Adam | 04/16/2024 | 05/01/2024 | Furn/Home Furnishings | |
| LOW | Double Bottom, Adam and Adam | 04/25/2024 | 05/01/2024 | Retail Building Supply | |
| MAS | Double Bottom, Adam and Eve | 04/25/2024 | 05/01/2024 | Building Materials | |
| MDT | Double Bottom, Adam and Adam | 04/18/2024 | 04/25/2024 | Medical Supplies | |
| MS | Pipe bottom | 04/08/2024 | 04/15/2024 | Securities Brokerage | |
| NFLX | Triple bottom | 04/22/2024 | 05/01/2024 | Internet | |
| ORI | Double Bottom, Adam and Adam | 04/17/2024 | 04/25/2024 | Insurance (Prop/Casualty) | |
| OLN | Double Bottom, Adam and Eve | 04/25/2024 | 05/02/2024 | Chemical (Basic) | |
| OTEX | Dead-cat bounce | 05/03/2024 | 05/03/2024 | E-Commerce | |
| OMI | Dead-cat bounce | 05/03/2024 | 05/03/2024 | Medical Supplies | |
| PHM | Pipe bottom | 04/15/2024 | 04/22/2024 | Homebuilding | |
| PSTG | Triple bottom | 04/19/2024 | 05/02/2024 | Computers and Peripherals | |
| QCOM | Pipe bottom | 04/15/2024 | 04/22/2024 | Telecom. Equipment | |
| RL | Triangle, symmetrical | 04/19/2024 | 05/09/2024 | Apparel | |
| ROL | Pipe bottom | 04/15/2024 | 04/22/2024 | Industrial Services | |
| R | Pipe bottom | 04/15/2024 | 04/22/2024 | Trucking/Transp. Leasing | |
| SEIC | Head-and-shoulders bottom | 04/19/2024 | 05/01/2024 | IT Services | |
| SMTC | Flag, high and tight | 03/20/2024 | 05/09/2024 | Semiconductor Cap Equip. | |
| SHW | Double Bottom, Adam and Eve | 04/23/2024 | 05/01/2024 | Chemical (Basic) | |
| SHOP | Dead-cat bounce | 05/08/2024 | 05/08/2024 | E-Commerce | |
| SNPS | Double Bottom, Eve and Adam | 04/19/2024 | 05/02/2024 | Computer Software and Svcs | |
| TER | Pipe bottom | 04/15/2024 | 04/22/2024 | Semiconductor Cap Equip. | |
| TTD | Pipe bottom | 04/15/2024 | 04/22/2024 | Advertising | |
| TOL | Pipe bottom | 04/15/2024 | 04/22/2024 | Homebuilding | |
| TWLO | Pipe bottom | 04/15/2024 | 04/22/2024 | E-Commerce | |
| VECO | Pipe bottom | 04/15/2024 | 04/22/2024 | Precision Instrument | |
| VRTX | Triple bottom | 04/18/2024 | 05/07/2024 | Biotechnology | |
| VC | Double Bottom, Adam and Adam | 04/18/2024 | 04/25/2024 | Electronics | |
| WMT | Double Bottom, Adam and Adam | 04/23/2024 | 05/02/2024 | Retail Store | |
| WSC | Double Bottom, Adam and Eve | 04/22/2024 | 05/01/2024 | Industrial Services | |
| IGV | Double Bottom, Adam and Adam | 04/19/2024 | 05/01/2024 | Computer Software and Svcs | |
| ITB | Diamond bottom | 04/16/2024 | 05/02/2024 | Homebuilding |
![]()
Support this site! Clicking any of the books (below) takes you to
Amazon.com If you buy ANYTHING while there, they pay for the referral.
Legal notice for paid links: "As an Amazon Associate I earn from qualifying purchases."
|
My Stock Market Books
|
My Novels
|