As of 04/30/2026
Indus: 49,652 +790.33 +1.6%
Trans: 20,794 +262.22 +1.3%
Utils: 1,165 +22.58 +2.0%
Nasdaq: 24,892 +219.07 +0.9%
S&P 500: 7,209 +73.06 +1.0%
|
YTD
+3.3%
+19.8%
+9.1%
+7.1%
+5.3%
|
|
As of 04/30/2026
Indus: 49,652 +790.33 +1.6%
Trans: 20,794 +262.22 +1.3%
Utils: 1,165 +22.58 +2.0%
Nasdaq: 24,892 +219.07 +0.9%
S&P 500: 7,209 +73.06 +1.0%
|
YTD
+3.3%
+19.8%
+9.1%
+7.1%
+5.3%
|
|
As of 04/30/2026
Indus: 49,652 +790.33 +1.6%
Trans: 20,794 +262.22 +1.3%
Utils: 1,165 +22.58 +2.0%
Nasdaq: 24,892 +219.07 +0.9%
S&P 500: 7,209 +73.06 +1.0%
|
YTD
+3.3%
+19.8%
+9.1%
+7.1%
+5.3%
| |
|
| ||
Page updated and 10 examples added 6/12/2025.
The three rising valleys chart pattern is one you will often see in the stock market and other markets. The reason for this begins with the rules for identification, where almost any three rising valleys qualify for a valid pattern. It is slightly more complicated than that with each succeeding valley resting above the prior one and the three valleys appearing similar. But beyond that, anything goes.
Based on test results discussed in my book, Encyclopedia of Chart Patterns, 3rd Edition, the chart pattern is a very good performer in a bull market. It confirms as a valid chart pattern when price closes above the highest peak in the pattern.
Since every trend change from down to up has to post a higher low, this pattern can signal a trend change when three higher lows appear. This type of "inside information" can be invaluable to traders, but just remember that the turn upward may not last long. In a bear market, the rise is just over half what it is in a bull market. And by the time the third bottom appears and the pattern confirms, price may be a long way from the bottom.
|
Overall performance rank (1 is best): 6 out of 39
Break even failure rate: 10%
Average rise: 48%
Throwback rate: 66%
Percentage meeting price target: 57%
The above numbers are based on 3,061 perfect trades. See the glossary for definitions. |

Three rising valleys
|
| Characteristic | Discussion |
| Weekly or daily | The pattern appears on either the daily or weekly chart. |
| Price trend | Usually upward leading to the pattern. |
| Shape | Look for three valleys -- the bottom of each valley must be above the prior one. |
| Proportional | Each valley should look similar. Select all narrow ones or all wide ones, all short, or all tall. Don’t mix them. |
| Volume | Trends downward 64% of the time. |
| Confirmation | The pattern confirms when price closes above the highest peak the pattern. |
| Trading Tactic | Explanation |

Measure Rule

Early Entry
|
| Measure rule | Reference the Measure Rule figure to the right. Compute the height from the highest peak (2) to the lowest valley (1) (between the 3 valleys of the three rising valleys chart pattern) and then multiply it by the above 'percentage meeting price target.' Add the difference to the highest peak (2) in the 3RV to get a price target (3). The link to the left provides more information on the measure rule. | |
| Early entry | Reference the lower right figure (Early Entry). If the highest peak (point A) in the three rising valley chart pattern is between the first two valleys (1 and 2), then draw a down-sloping trendline connecting the two highest peaks in the 3RV chart pattern. A close above the trendline signals a buy. | |
| Stop | Reference the lower right figure (Early Entry). Place a stop slightly below the last minor low (point 3) in the three rising valleys chart pattern. The link to the left discusses stop placement in depth. | |
| Yearly high | Patterns that breakout within a third of the yearly high perform best. | |
| Continuations | Patterns that act as continuations perform better than reversals. | |
| Breakout volume | Below average breakout volume suggests better performance for this chart pattern. For more information, click the link to the left. | |
| Gain | The farther up the price trend the pattern appears, the smaller the potential gain. These two, Study 1 and Yearly low discuss the findings. |

The above figure shows an example of the three rising valleys chart pattern. Valleys 1, 2, and 3 mark the outline of the chart pattern. Point 4 is the confirmation price, the price at which squiggles on the chart become a three rising valleys chart pattern.
Taking the height from peak 4 (the highest high in the three rising valleys chart pattern) and valley 1 (the lowest low between the three valleys), multiplying it by the 'percentage meeting price target' from Important Bull Market Results table near the top of this page, gives a target of about 45. The stock climbed to the target a few weeks after the breakout. Shown on the log scale.
The following is a slide show. Click the right or left arrows, or the circles below the chart to navigate around the slides.
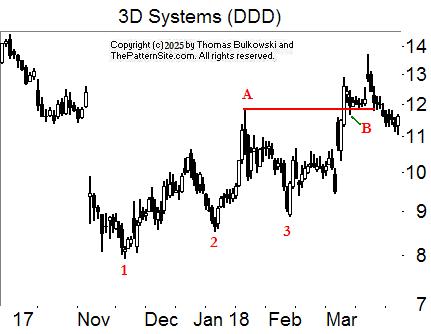
Numbers 1, 2, and 3 are the three valleys of the three rising valleys pattern. Peak A is the tallest peak between the three valleys. Price must close above this peak to confirm the 3RV as valid. At B, we see the stock has completed a short throwback. Throwbacks happen 66% of the time in this chart pattern.

The three rising valleys pattern is at 123 with confirmation at the red line, A, and a throwback to B.

Another example of a three rising valleys pattern with confirmation.

Another example of a three rising valleys pattern with confirmation.

Is this an example of a 3RV? The possible combination of a three rising valleys pattern can be 123, 234, or 134. Valleys 1 and 4 look similar as do 2 and 3. So maybe none of the combinations give a perfect example of the chart pattern.

Lots of potential three rising valleys patterns here: 123, 234, 345, 456 and 567. Note that the longer you wait to verify and trade the pattern, the higher the risk (meaning the confirmation price climbs closer to the trend end). Before trading this pattern, check for prior three rising valleys in the same uptrend. If you find some, then consider abandoning any potential trade.

Another example of a three rising valleys pattern with confirmation. It's not clear from the chart how far price climbed after this one.

Another example of a three rising valleys pattern with confirmation. It's not clear from the chart how far price climbed after this one.

Another example of a three rising valleys pattern.

This three rising valleys pattern can be 142 or 123 or 423. Note that confirmation of 142 and 423 show nearly the same confirmation price. Also notice how price plummeted after peaking, probably handing many 3RV traders a loss.
-- Thomas Bulkowski
Support this site! Clicking any of the books (below) takes you to
Amazon.com If you buy ANYTHING while there, they pay for the referral.
Legal notice for paid links: "As an Amazon Associate I earn from qualifying purchases."
|
My Stock Market Books
|
My Novels
Orb Foresight Rewrite Coming!
|
Always late but worth the wait.![]()