As of 05/04/2026
Indus: 48,942 -557.37 -1.1%
Trans: 19,606 -992.51 -4.8%
Utils: 1,153 -4.13 -0.4%
Nasdaq: 25,068 -46.64 -0.2%
S&P 500: 7,201 -29.37 -0.4%
|
YTD
+1.8%
+13.0%
+7.9%
+7.9%
+5.2%
|
|
As of 05/04/2026
Indus: 48,942 -557.37 -1.1%
Trans: 19,606 -992.51 -4.8%
Utils: 1,153 -4.13 -0.4%
Nasdaq: 25,068 -46.64 -0.2%
S&P 500: 7,201 -29.37 -0.4%
|
YTD
+1.8%
+13.0%
+7.9%
+7.9%
+5.2%
|
|
As of 05/04/2026
Indus: 48,942 -557.37 -1.1%
Trans: 19,606 -992.51 -4.8%
Utils: 1,153 -4.13 -0.4%
Nasdaq: 25,068 -46.64 -0.2%
S&P 500: 7,201 -29.37 -0.4%
|
YTD
+1.8%
+13.0%
+7.9%
+7.9%
+5.2%
| |
|
| ||
Released 11/30/2023.
Below is the updated forecast for 2023 as of the close on November 30, 2023. Captions appear below the pictures for guidance, so be sure to scroll down far enough to read them.
On some of the charts (all except the CPI chart) the prediction in red is based on the work of Edgar Lawrence Smith in the 1930s. Smith said that the stock market followed a 10-year cycle. Each year tended to repeat the behavior of the year a decade earlier. In other words, if you averaged all years ending in 1 (2001, 1991, 1981 and so on), that would give you a forecast for 2011. For 2012, you'd make a similar average, only use 2002, 1992, 1982, and so on. That's what I did for the market forecast charts which follow.
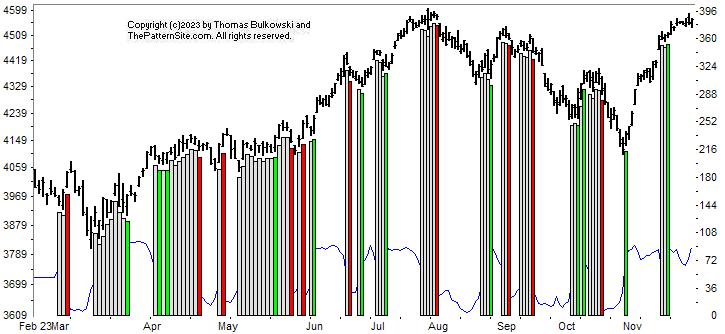
This is a chart of the Chart Pattern Indicator (CPI) on the daily scale.
Today (Thursday 11/30/23) the index made a big move higher (Dow industrials up 520 points, S&P up 17), lifting the general market. Not all stocks participated. The tech-heavy Nasdaq dropped a bit (down 32 points).
The CPI is solidly bullish.
From what we can see on the thin blue line from November, it looks like bearish divergence with the CPI trending downward even as the S&P moves higher.
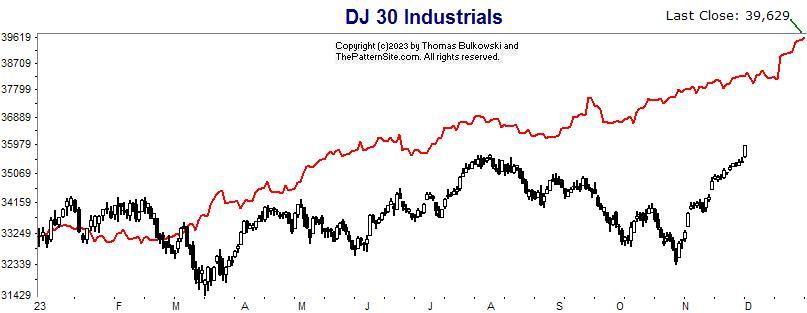
This is a chart of the Dow industrials on the daily scale.
As the chart shows, the Dow is well below the forecast. It has a lot to climb if it's to make the forecast 39,629 close.
Will it make it? If it has another rise like it had from the November low, then yes, it will.
I have my doubts. I'm still expecting weakness in the first half of December in tech stocks.
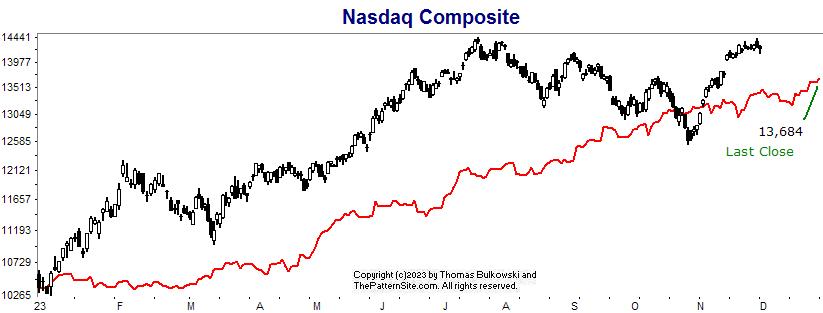
This is the Nasdaq on the daily chart.
This chart shows the opposite of the prior one. The Nasdaq has outperformed the forecast. I think there's a decent chance that the index will retrace and close near the forecast of 13,684.
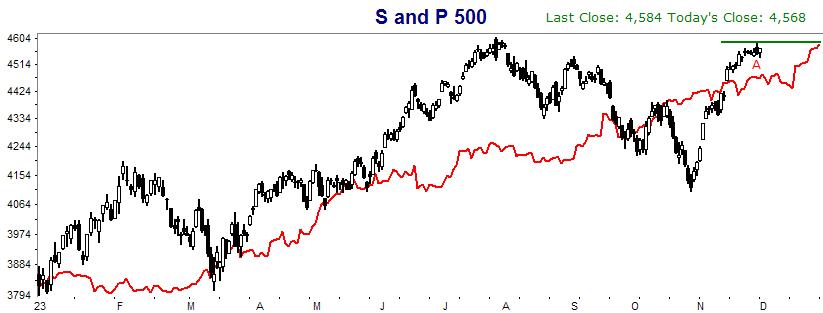
Here's the S&P 500 index on the daily scale.
This chart is like the 3 little bears. The first index didn't eat enough. The second one ate too much, and this one ate the right amount.
The index at A is almost exactly on target to close at 4,584. Not a bad forecast, given that I made it in January. The ride was more bumpy than expected.
Support this site! Clicking any of the books (below) takes you to
Amazon.com If you buy ANYTHING while there, they pay for the referral.
Legal notice for paid links: "As an Amazon Associate I earn from qualifying purchases."
|
My Stock Market Books
|
My Novels
Orb Foresight Rewrite Coming!
|