As of 04/08/2026
Indus: 47,910 +1,325.46 +2.8%
Trans: 20,169 +630.50 +3.2%
Utils: 1,179 +8.26 +0.7%
Nasdaq: 22,635 +617.14 +2.8%
S&P 500: 6,783 +165.96 +2.5%
|
YTD
-0.3%
+16.2%
+10.4%
-2.6%
-0.9%
|
|
As of 04/08/2026
Indus: 47,910 +1,325.46 +2.8%
Trans: 20,169 +630.50 +3.2%
Utils: 1,179 +8.26 +0.7%
Nasdaq: 22,635 +617.14 +2.8%
S&P 500: 6,783 +165.96 +2.5%
|
YTD
-0.3%
+16.2%
+10.4%
-2.6%
-0.9%
|
|
As of 04/08/2026
Indus: 47,910 +1,325.46 +2.8%
Trans: 20,169 +630.50 +3.2%
Utils: 1,179 +8.26 +0.7%
Nasdaq: 22,635 +617.14 +2.8%
S&P 500: 6,783 +165.96 +2.5%
|
YTD
-0.3%
+16.2%
+10.4%
-2.6%
-0.9%
| |
|
| ||
Released 12/30/2022.
Below is the updated forecast for 2023 as of the close on December 30, 2022 (year end close). Captions appear below the pictures for guidance, so be sure to scroll down far enough to read them.
On some of the charts (all except the CPI chart) the prediction in red is based on the work of Edgar Lawrence Smith in the 1930s. Smith said that the stock market followed a 10-year cycle. Each year tended to repeat the behavior of the year a decade earlier. In other words, if you averaged all years ending in 1 (2001, 1991, 1981 and so on), that would give you a forecast for 2011. For 2012, you'd make a similar average, only use 2002, 1992, 1982, and so on. That's what I did for the market forecast charts which follow.
Let's review where we've been first and then, starting at slide 6, we'll look where were going.
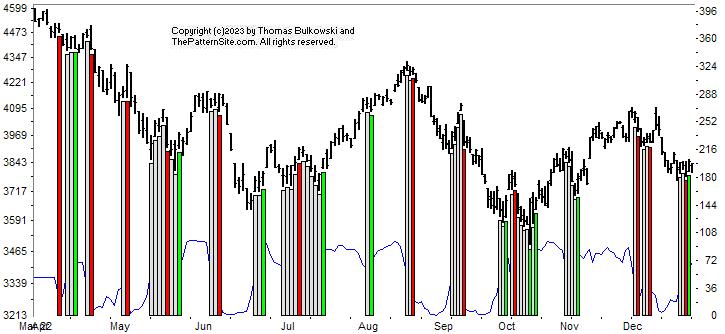
This is a graph of the chart pattern indicator (CPI) against the S&P 500 index. Briefly, the CPI counts the number of bullish patterns to bearish ones in the belief that at significant market turns, the bearish patterns will outnumber the bullish ones, or vice versa. The thin blue line at the bottom of the chart is the CPI.
The CPI ended the year with a bullish signal. I show that by the green vertical bar on the far right of the chart. It closed the year with a 65% reading, which is right on the edge of neutral and bullish. Note that the indicator can change its mind for up to a week, so the signal could disappear if the market drops.

This is the year end 2022 numbers.
The best performing index this year was the utilities, down 1.4%. The worst performer was the Nasdaq, down over 33%. All of these numbers don't include dividends. With dividends, I'd expect the utilities to move into the plus column.
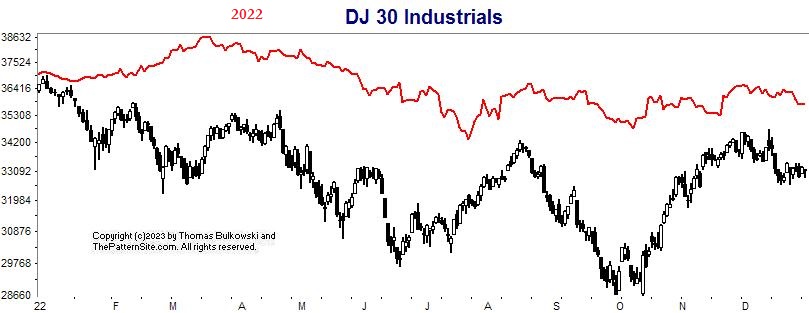
This is a chart of the Dow industrials on the daily scale. The 2022 forecast is in red, made in January.
The forecast suggested the industrials would end the year lower and they did. The waveform of the red and black lines are similar in shape but the extent of the black OHLC chart has steeper hills and valleys compared to the red line. The index was forecast to close the year at 35,531 but it actually closed it at 33,147.
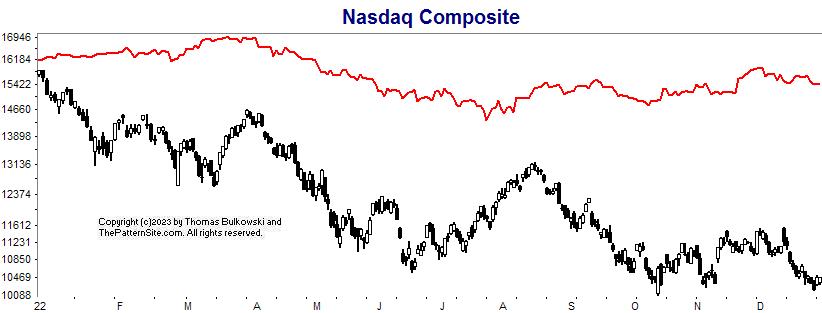
This is the Nasdaq on the daily chart.
The forecast said the index would close lower, and it did. It also said the Nasdaq would reach the yearly low in July but it actually hit bottom in October.
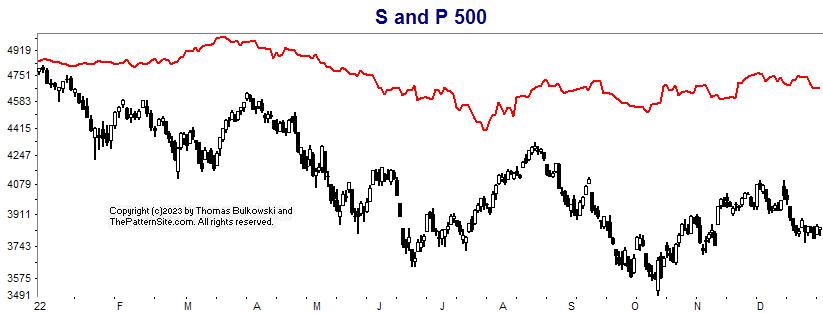
Here's the S&P 500 index on the daily scale.
The forecast was for a small decline but the actual index closed much lower, down 19.4% without dividends reinvested.
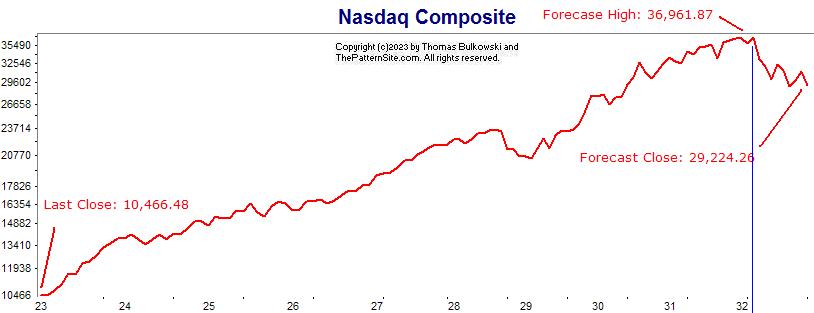
This is the forecast going out to 2032, using the monthly scale.
The Nasdaq closed 2022 at 10,466. In 9 years, in early 2032, the index will peak at 36,961 before declining to end the year at 29,224. That's the forecast.
After a flat start in 2023, look for the index to make a strong recovery to the start of 2024. It looks to continue higher until mid 2028 before it hits turbulence.
The thin vertical blue line shows the timing of the index where it reaches its peak in early 2032. It drops about 20% from the peak in 2032, suggesting the start of the next bear market.
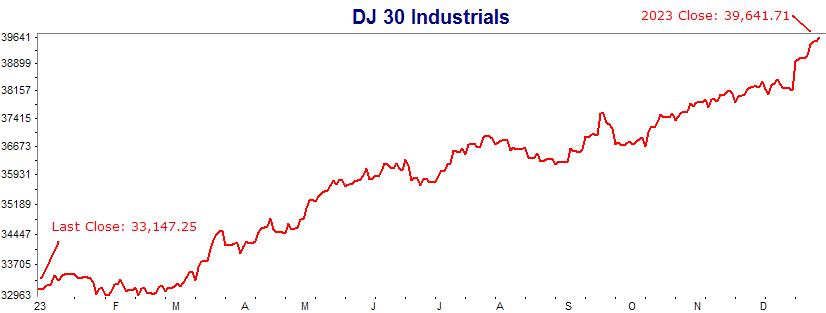
Here's the 2023 forecast for the Dow industrials, on the daily scale. It should close about 20% higher if the forecast is correct. You have until March to make your investments before takeoff.
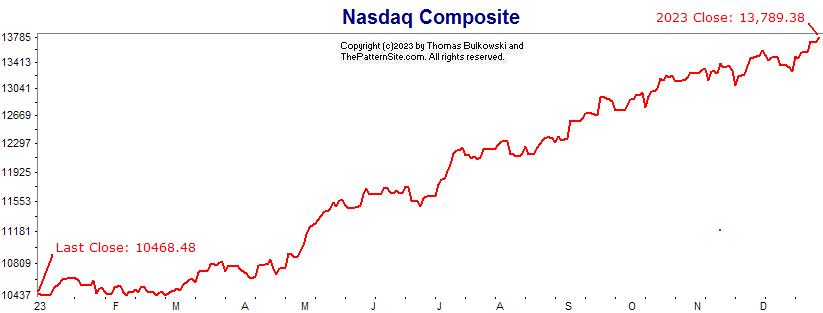
This is the Nasdaq on the daily chart for 2023.
The index is projected to rise almost 30% in 2023. Yippee! Let's just hope it's close. On this chart, we begin liftoff in late February.
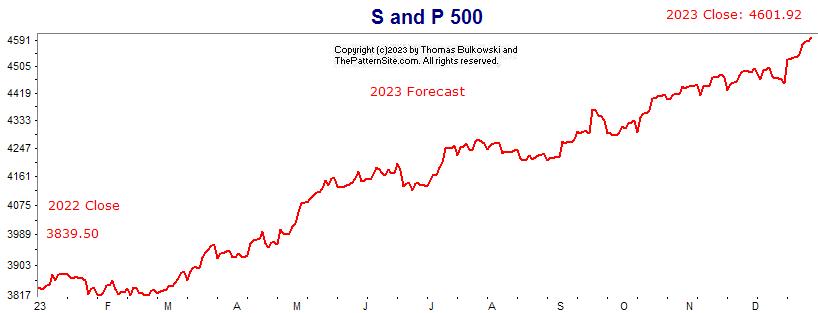
Here's the S&P 500 index on the daily scale for 2023.
It also shows the index rising about 20%.
Support this site! Clicking any of the books (below) takes you to
Amazon.com If you buy ANYTHING while there, they pay for the referral.
Legal notice for paid links: "As an Amazon Associate I earn from qualifying purchases."
|
My Stock Market Books
|
My Novels
Orb Foresight Rewrite Coming!
|