As of 04/02/2026
Indus: 46,505 -61.07 -0.1%
Trans: 19,089 +159.40 +0.8%
Utils: 1,174 +8.73 +0.7%
Nasdaq: 21,879 +38.23 +0.2%
S&P 500: 6,583 +7.37 +0.1%
|
YTD
-3.2%
+10.0%
+9.9%
-5.9%
-3.8%
|
|
As of 04/02/2026
Indus: 46,505 -61.07 -0.1%
Trans: 19,089 +159.40 +0.8%
Utils: 1,174 +8.73 +0.7%
Nasdaq: 21,879 +38.23 +0.2%
S&P 500: 6,583 +7.37 +0.1%
|
YTD
-3.2%
+10.0%
+9.9%
-5.9%
-3.8%
|
|
As of 04/02/2026
Indus: 46,505 -61.07 -0.1%
Trans: 19,089 +159.40 +0.8%
Utils: 1,174 +8.73 +0.7%
Nasdaq: 21,879 +38.23 +0.2%
S&P 500: 6,583 +7.37 +0.1%
|
YTD
-3.2%
+10.0%
+9.9%
-5.9%
-3.8%
| |
|
| ||
Updated and added 10 examples on 6/17/25.
For more information on this pattern, read Encyclopedia of Chart Patterns, 3rd Edition.
If you click on this link and then buy the book (or anything) at Amazon.com, the referral will help support this site. Thanks. -- Tom Bulkowski
$ $ $

The inverted and ascending scallop looks like the right half of an umbrella. The beauty of this chart pattern is that it performs so well in both bull and bear markets, sporting a low break even failure rate and a large average rise.
Discovered by Thomas Bulkowski in the early 2000's but it may have been uncovered by others earlier.
The above numbers are based on 1,776 perfect trades. See the glossary for definitions.
| Characteristic | Discussion |
| Price trend | Most often you'll see these in an upward trend leading to the pattern or at the bullish turning point of a downward price trend. |
| Shape | Inverted and backward J shape. It looks like the right half of an umbrella. The rise should be a straight, or nearly straight run up, then rounded at the top followed by a small decline. |
| Smooth top | The peaks should form a rounded turn but larger patterns may not be as smooth. |
| Retrace | The end of the pattern on the right usually retraces 54% of the prior up move. Avoid 100% retraces. |
| Volume | Trends downward 70% of the time |
| Confirmation | The pattern confirms when price closes above the highest high in the pattern. |
Consult the associated figures on the right.
| Trading Tactic | Explanation | 
The Measure Rule

New Stop Location
|
| Measure rule | Compute the height from the highest peak (B) to the lowest valley in the pattern (A) and then multiply it by the above 'percentage meeting price target.' Add the difference to the highest peak (B) to get a price target C. The link to the left provides more information on the measure rule. | |
| Stop | If price drops below the right scallop edge, sell. See the measure rule figure to the right for the proper stop location. | |
| Buy | Buy when price closes above the highest peak in the pattern (B). | |
| Swingers | Swing traders will want to buy when price bottoms on the right and sell when it climbs to the top of the pattern. | |
| Avoid | If price drops below the start of the pattern (A), then avoid this one. | |
| Avoid valley | If price forms a distinct right valley and then price drops below the valley, sell. The figure to the right ("New Stop Location") shows the proper location for a stop in this situation. | |
| Breakout volume | Heavy breakout volume suggests better performance. The link shown to the left discusses statistics on breakout volume. The following link gives additional information on other chart patterns that also do well after heavy breakout volume. |

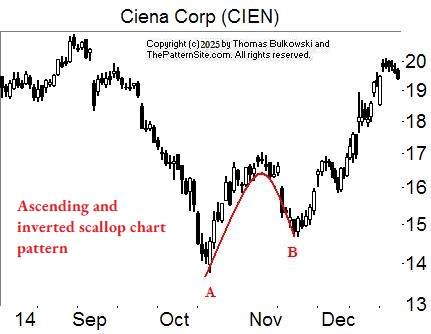
The figure on the right shows an example of an inverted and ascending scallop chart pattern. Price bottoms at point A and then rises to B where it rounds downward to C.
To calculate a price target, subtract the price of valley A from peak B. That finds the height. Multiply the height by 64% (the percentage meeting price target from Important Bull Market Results table near the top of this page) and add the result to the price at B. Place a stop loss order a few pennies below C, and raise the stop as price climbs.
The following is a slide show. Click the right or left arrows, or the circles below the chart to navigate around the slides.
AB shows the scallop. This one, as with most inverted and ascending scallops (95%), breaks out upward when price closes above the top of the chart pattern.

Here are two ascending and inverted scallops, AB and BC.

This chart shows an ascending and inverted scallop but the breakout direction isn't clear. It's upward, though. The pattern isn't as smooth as I like to see.

Ascending and inverted scallop AB breaks out downward when the stock closes below A, which happens at C.

Ascending and inverted scallop AB shows a red line at C, which is the upward breakout price.

Ascending and inverted scallop AB breaks out upward at C. Notice that price didn't rise far before tumbling and busting the upward breakout.

Ascending and inverted scallop, AB.

This ascending and inverted scallop breaks out downward at D when the stock closes below A. At C, the stock was higher than the top of the scallop, but it didn't close higher.

Ascending and inverted scallop in red.

Shown are three ascending and inverted scallops.
-- Thomas Bulkowski
Support this site! Clicking any of the books (below) takes you to
Amazon.com If you buy ANYTHING while there, they pay for the referral.
Legal notice for paid links: "As an Amazon Associate I earn from qualifying purchases."
|
My Stock Market Books
|
My Novels
Orb Foresight Rewrite Coming!
|
Organized people are just too lazy to look for things.![]()