As of 05/01/2026
Indus: 49,499 -152.87 -0.3%
Trans: 20,598 -195.32 -0.9%
Utils: 1,157 -8.12 -0.7%
Nasdaq: 25,114 +222.13 +0.9%
S&P 500: 7,230 +21.11 +0.3%
|
YTD
+3.0%
+18.7%
+8.3%
+8.1%
+5.6%
|
|
As of 05/01/2026
Indus: 49,499 -152.87 -0.3%
Trans: 20,598 -195.32 -0.9%
Utils: 1,157 -8.12 -0.7%
Nasdaq: 25,114 +222.13 +0.9%
S&P 500: 7,230 +21.11 +0.3%
|
YTD
+3.0%
+18.7%
+8.3%
+8.1%
+5.6%
|
|
As of 05/01/2026
Indus: 49,499 -152.87 -0.3%
Trans: 20,598 -195.32 -0.9%
Utils: 1,157 -8.12 -0.7%
Nasdaq: 25,114 +222.13 +0.9%
S&P 500: 7,230 +21.11 +0.3%
|
YTD
+3.0%
+18.7%
+8.3%
+8.1%
+5.6%
| |
|
| ||
Updated and added 10 examples on 7/16/25.
A big W is a double bottom with tall sides. Price often confirms the double bottom and approaches the height of the left side trend start before retracing and forming a handle. Once price completes the handle, the rise resumes. For a more detailed analysis of this pattern, buy a copy of Encyclopedia of Chart Patterns, 3rd Edition (#AD).

The above numbers are based on more than 2,100 perfect trades. See the glossary for definitions.
| Characteristic | Discussion |
| Price trend | Downward leading to the pattern. |
| Shape | A big W shape with twin bottoms and tall sides. |
| Reversal pattern | Look for a double bottom reversal pattern at the base of the big W. |
| Tall sides | The best performing big W chart patterns have tall, straight declines leading to the bottom of the big W. |
| Rise between bottoms | The rise between the valleys of the double bottom is 10% to 20% or more (but be flexible). |
| Volume | Recedes 69% of the time between the two bottoms. |
| Breakout Confirmation | The pattern confirms as a valid one when price closes above the highest peak between the two bottoms. |
![]()
Consult the associated figure on the right.
| Trading Tactic | Explanation | 
The Measure Rule
|
| Measure rule | Compute the height from the highest peak to the lowest valley (D-B) and then add the result to the price of the peak high, D. The result is the target price. The link to the left gives more information about the measure rule. | |
| Breakout | Occurs when price closes above the peak high (D). | |
| Stall | For swing traders, buy at the double bottom low (E) and ride price upward to confirmation of the double bottom (the high between the two bottoms, D). Price often pauses there. If price drops below the low of the second bottom (E), exit the position immediately. If price confirms the double bottom, expect a rise approaching the left side high (A). | |
| Position traders | Wait for confirmation of the double bottom before taking a position and be prepared to sell as the stock nears the price of the left side high (the price at C approaches the price at A). |
![]()

The above figure shows an example of a big W chart pattern. Price begins its decline at A and reaches a low at B in just a few months. Price bounces and retraces to form a second low in September (C). The Eve & Adam double bottom confirms as a valid chart pattern when price closes above the confirmation line, as shown. A nice-looking symmetrical triangle appears during October.
I present the information in slider format, so be sure to click the left or right arrows to view another slide.

If you believe in Elliott wave, then look for an ABC correction. After price advances in 5 waves (higher in this case), you'll see price drop, retrace, and drop again as the red ABC lettering shows. After the ABC pattern ends, we see a Big W form. The belief is that you'll see price rise again in 5 or more waves. If that's true (I don't know if it is), then this setup is a high probability winner.
The green circle outlines the ABC pattern.

In the chart pattern world, an ABC correction is called a measured move down (MMD). In a MMD, price drops, retraces, and drops again. However, after the pattern completes, look for a return to the corrective phase (BC).
Using letters, the measured move is ABCD. Leg CD is supposed to equal leg AB, but rarely does. The corrective phase is BC and it posed overhead resistance to an advance.
In this example, the stock reversed in the corrective phase, causing a loss.

Here's an example of an event pattern called a bad earnings surprise. After the announcement of earnings, the market doesn't like the results and the stock gaps down. After a week to 10 days, you'll often see price bottom and start to rise. However, because earnings are so important, the stock may falter and reverse as in the case here, resulting in a losing trade.
In other words, check news on the stock. If it's not good, then pick another stock.

Sometimes a chart screams that a pattern is forming. In this case, the chart pattern is a head-and-shoulders top. I show the left shoulder and head. I drew a green line to signal where to enter the trade, but already the potential head-and-shoulders was visible. I'd avoid the trade because of the bearish head-and-shoulders top.
Indeed, a right shoulder formed and the stock returned to the level of the launch price.
The following is a slide show. Click the right or left arrows, or the circles below the chart to navigate around the slides.
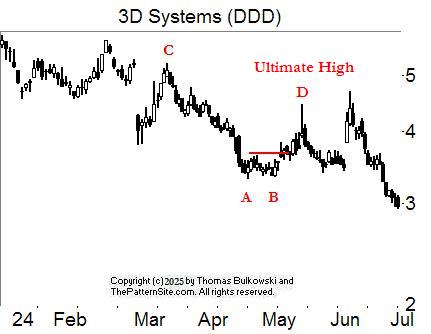
This is an example of a big W chart pattern. The big W is at AB. Price has a tall side that begins at C and price drops to A. From B, it only makes it up to D before tumbling. D is the ultimate high, the highest price reached before the stock dropped by more than 20%.

This is the way a big W should work! The pattern is at AB. D is the launch price where the downtrend begins. And C is the recovery high (so far).

This big W (AB) has not reached its full potential (C) yet (D).

The AB big W sees price rise to C, where it reaches the ultimate high. It doesn't come close to the target of the high on the left side. In these ten examples, I show the target as the top of the tall left side and not the one computed by the measure rule.

I show this big W on the weekly chart to fit it on the screen. AB is the big W. C is the target. D is how high the price climbed so far. The rise to D is because of a buyout offer from Home Depot.

This big W (AB) also sees price at D reach the target C.

The big W at AB sees price rise to E before tumbling and forming a triple bottom (ABC). At F, the stock exceeds the left side of the big W (D).

Big W AB has a throwback pattern at D after reaching the height of the left side of the pattern, C. A throwback appears 64% of the time in big Ws.

This big W (AB) gave up trying to reach the height of the left side, C.

Big W AB meets the target C at D. Looking back farther to the left, we see another target E. Price reached that target, also.
-- Thomas Bulkowski
![]()
Support this site! Clicking any of the books (below) takes you to
Amazon.com If you buy ANYTHING while there, they pay for the referral.
Legal notice for paid links: "As an Amazon Associate I earn from qualifying purchases."
|
My Stock Market Books
|
My Novels
Orb Foresight Rewrite Coming!
|
Any minute now I'll jump in with pointless observations.![]()