As of 03/31/2026
Indus: 46,342 +1,125.37 +2.5%
Trans: 18,610 +579.97 +3.2%
Utils: 1,159 +0.80 +0.1%
Nasdaq: 21,591 +795.99 +3.8%
S&P 500: 6,529 +184.80 +2.9%
|
YTD
-3.6%
+7.2%
+8.5%
-7.1%
-4.6%
|
|
As of 03/31/2026
Indus: 46,342 +1,125.37 +2.5%
Trans: 18,610 +579.97 +3.2%
Utils: 1,159 +0.80 +0.1%
Nasdaq: 21,591 +795.99 +3.8%
S&P 500: 6,529 +184.80 +2.9%
|
YTD
-3.6%
+7.2%
+8.5%
-7.1%
-4.6%
|
|
As of 03/31/2026
Indus: 46,342 +1,125.37 +2.5%
Trans: 18,610 +579.97 +3.2%
Utils: 1,159 +0.80 +0.1%
Nasdaq: 21,591 +795.99 +3.8%
S&P 500: 6,529 +184.80 +2.9%
|
YTD
-3.6%
+7.2%
+8.5%
-7.1%
-4.6%
| |
|
| ||
Updated and added 10 examples on 8/8/25.
My book, Encyclopedia of Chart Patterns, 3rd Edition (#ad) covers gaps. The book discusses performance statistics and explores how gaps behave. It's worth buying a copy.

Gaps are useful for showing support or resistance zones but as a tradeable, by the time you properly identify them, the move is nearly over. If you already own a stock and a chart pattern breaks out in a gap, then hold on for a strong move. Performance improves two-thirds of the time in the chart patterns I looked at.
Percentage of Upward gaps closing within a week:
Area gaps: 85%Breakaway gaps: 1%Continuation gaps: 8%Exhaustion gaps: 60%
Percentage of downward gaps closing within a week:
Area gaps: 90%Breakaway gaps: 1%Continuation gaps: 15%Exhaustion gaps: 66%The above numbers, combined, are based on over 1,100 samples. See the glossary for definitions.
![]() More (#ad)
More (#ad)
Gaps occur when today's high is below yesterday's low (bearish gap), or today's low is above yesterday's high (bullish gap).
| Gap Type | Discussion |
| Area, common or pattern gaps | These are synonyms for the same gap type. Occurs in congestion (trendless markets) and closes quickly, usually in a few days. Volume on the gap day may be high but returns to normal in a day or two. Few new highs (upward trends) or lows (downward trends) occur after the gap. A distinctive price curl as the gap closes quickly is a clue to this gap type. |
| Breakaway gaps | Starts a new trend and the gap often occurs on leaving a consolidation area, usually on high volume on the gap day, which can continue for several days. Price trends for several days. |
| Continuation, measuring, or runaway gaps | These are synonyms for the same gap type. Continuation gaps occur during a straight-line advance or decline. Price makes new highs or lows without closing the gap. Volume is usually high. |
| Ex-dividend gaps | Caused by a dividend distribution. Price moves down by the amount of the dividend and a gap appears but it's usually closed by the end of the trading day. |
| Exhaustion gaps | Happens at the end of a trend on high volume. The gap is usually not followed by new highs or lows, and the gap may be unusually tall. After the gap, price consolidates or reverses direction. Commonly occurs after continuation gaps. Exhaustion gaps usually close within a week. |
![]() More (#ad)
More (#ad)
| Gap Type | Explanation |
| Area, common or pattern gaps | These close too quickly to be of trading significance. |
| Breakaway gaps | Look for a high volume gap and trade in the direction of the trend. The best performance comes from breakaway gaps in a bull market near the yearly high. In a bear market, trade those near the yearly low. |
| Continuation, measuring, or runaway gaps | On a time basis, usually marks the halfway point in an upward price move. By price, the middle of the gap appears between 50% and 52% along the very short-term trend (usually the distance between the closest minor high and low). Measure from the swing low or high to the gap center and project from the gap center to the predicted high or low. |
| Ex-dividend gaps | These close too quickly to be of trading significance. |
| Exhaustion gaps | If an unusually tall gap occurs, it may mark the end of the trend (immediately or within a few days). Violent reversals can follow an exhaustion gap, so consider taking a position in the new direction. |
| Stop loss | Gaps are places of weak support or resistance, but you can use them for a stop location. Place a stop a few cents below the gap (upward breakouts) or above the gap (downward breakouts). |
![]() More (#ad)
More (#ad)
Closing the gap means price rises/declines to fill the gap, covering the opening. See the chart near the top of this page for an example of a closed gap.
| Trading Tactic | Time to Close the Gap |
| Area, common or pattern gaps | 3-4 days for both gap directions |
| Breakaway gaps | 89 days for upward gaps, 84 days for downward gaps. |
| Continuation, measuring, or runaway gaps | 45 days for upward gaps, 25 days for downward gaps. |
| Exhaustion gaps | 6 days for upward gaps, 5 days for downward gaps. |
Tip: Gaps that occur on the day of a chart pattern breakout suggest a better performing chart pattern two out of three times, regardless of the breakout direction.
![]() More (#ad)
More (#ad)

The above figure shows examples of various gap types. Breakaway gaps exit from congestion areas. Area gaps close quickly. Exhaustion gaps appear at the end of a trend. Continuation gaps appear in the middle of trends.
![]() More (#ad)
More (#ad)
The following is a slide show. Click the right or left arrows, or the circles below the chart to navigate around the slides.
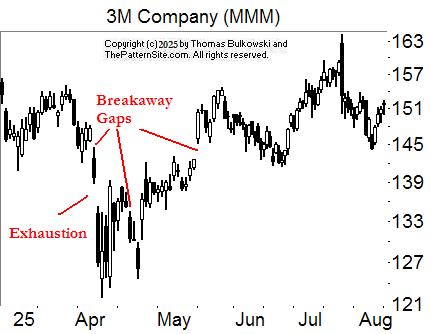
Breakaway gaps leave a consolidation area. The exhaustion gap sees price close the gap quickly, and it comes after (or near) the end of a trend.

The continuation gap sees price continue the downtrend in this example.

Area gaps closes quickly. Exhaustion gaps can be tall.

The gap on the upper left, marked here as a breakaway, might be an exhaustion gap because price stops trending. However, the gap forms as price leaves a consolidation area (a sideways move area).

More gaps.
-- Thomas Bulkowski
![]() More (#ad)
More (#ad)
Support this site! Clicking any of the books (below) takes you to
Amazon.com If you buy ANYTHING while there, they pay for the referral.
Legal notice for paid links: "As an Amazon Associate I earn from qualifying purchases."
|
My Stock Market Books
|
My Novels
Orb Foresight Rewrite Coming!
|
Computers are not intelligent. They only think they are.![]()