
As of 05/17/2024
Indus: 40,004 +134.21 +0.3%
Trans: 15,501 -59.49 -0.4%
Utils: 951 +1.46 +0.2%
Nasdaq: 16,686 -12.35 -0.1%
S&P 500: 5,303 +6.19 +0.1%
|
YTD
+6.1%
-2.5%
+7.9%
+11.2%
+11.2%
|
|
As of 05/17/2024
Indus: 40,004 +134.21 +0.3%
Trans: 15,501 -59.49 -0.4%
Utils: 951 +1.46 +0.2%
Nasdaq: 16,686 -12.35 -0.1%
S&P 500: 5,303 +6.19 +0.1%
|
YTD
+6.1%
-2.5%
+7.9%
+11.2%
+11.2%
| |
|
| ||
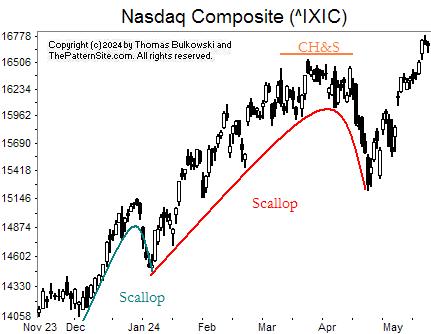
The chart doesn't show much action so I looked back to find patterns to discuss. The chart is on the daily scale, of the Nasdaq composite.
In green is a scallop, but the official name is an inverted and ascending scallop. Those patterns have a straight run up (or nearly so) followed by a rounded turn at the top which retraces a portion of the prior up move.
Another inverted and ascending scallop appears in red. Both have upward breakouts (when price closes above the top of the pattern).
A third chart patterns appears in brown or orange, depending on how much you've had to drink. ![]() It's a complex head-and-shoulders top.
This example has one left shoulder, two right ones, and a head in between. Often I ignore patterns with odd numbers of shoulders (they should be equidistant from the head in time, price, and number of peaks), so this one is weird.
This one breaks out downward when it closes below a neckline that I didn't draw.
It's a complex head-and-shoulders top.
This example has one left shoulder, two right ones, and a head in between. Often I ignore patterns with odd numbers of shoulders (they should be equidistant from the head in time, price, and number of peaks), so this one is weird.
This one breaks out downward when it closes below a neckline that I didn't draw.
What does this mean for the index going forward? Nothing. However, a trend in motion tends to remain in motion, so look for the upward move of the last few weeks to continue.
![]()
The following is a brief review of how the markets performed over time. The numbers refer to the close-to-close move in the Dow industrials.
No options expire this week.
![]()
The following is based on an SFO article in December 2004 by John Seekinger, titled, "Take a two-dimensional approach." He offers these tips.
| Index | S2 | S1 | Pivot | R1 | R2 |
| Dow Industrials (^DJI): Daily | 39,806 | 39,905 | 39,958 | 40,057 | 40,110 |
| Weekly | 39,130 | 39,567 | 39,809 | 40,246 | 40,488 |
| Monthly | 36,783 | 38,393 | 39,222 | 40,833 | 41,662 |
| S&P500 (^GSPC): Daily | 5,276 | 5,289 | 5,297 | 5,311 | 5,319 |
| Weekly | 5,166 | 5,234 | 5,280 | 5,349 | 5,394 |
| Monthly | 4,822 | 5,063 | 5,194 | 5,435 | 5,566 |
| Nasdaq (^IXIC): Daily | 16,563 | 16,624 | 16,675 | 16,737 | 16,788 |
| Weekly | 16,143 | 16,415 | 16,606 | 16,878 | 17,069 |
| Monthly | 14,660 | 15,673 | 16,236 | 17,248 | 17,811 |
Here are the formulas:
![]()
Earnings season is either underway or should be starting soon. The sessions could be more volatile.
Here's a symbol list of 104 chart and candlestick patterns (13 "investment grade" candle patterns) found in today's securities using my version of Patternz: MMM, ACN, ALKS, DOX, AFG, AMGN, ANIK, APA, ARW, ASH, BCPC, BKNG, BRKR, CLS, CX, CENX, CRL, CSCO, CNO, CMTL, CONN, CSGP, CSGS, DSGR, EOG, EXC, EXPI, FARO, FDX, FWRD, GME, GGG, THG, HL, HSIC, HOLX, JBHT, NSP, IBP, IIIN, IPAR, TILE, IPI, ISRG, JBLU, KBH, K, KELYA, KFRC, LH, LAMR, LNC, RAMP, MANH, MKTX, MTRN, MUR, NOC, OR, OXM, PDCO, PCG, PGR, RHI, RGLD, RES, SAND, SWX, UIS, WEX, WMB, WSC, WDAY, ZBRA, IYC, IXC, MXI, SLV, EWA, EWO, EWC, ECH, EWH, EWI, EWM, EWS, EZA, EWL, THD, TUR, EWU, GLD, XRT, VHT. Click this link for details (pattern type, start and end dates).
For a list of small patterns (those a few days wide) click this link.
The below industries were the best (rank 1) or worst performing of those I follow.
|
-- Thomas Bulkowski, author: Invest for Two-Comma Wealth and Training "Miles" (#Ad) ![]()
![]()
$ $ $
Here's a symbol list of 141 chart and candlestick patterns (13 "investment grade" candle patterns) found in today's securities using my version of Patternz: DDD, MMM, ABM, ACIW, ADTN, AMD, APD, ALGT, AEO, AXP, AFG, AMWD, ANIK, APOG, ARCB, ACGL, ARW, ASH, AGO, BSET, BAX, BKNG, BFH, BRKR, BBW, CACI, CNC, CI, CSCO, CNO, CGNX, CMTL, CONN, CSGP, CR, CROX, CSGS, CMI, DECK, DVN, DDS, DFS, EBAY, EQT, EXC, FLEX, FTNT, GME, GMS, GOOGL, GPRO, GES, HBI, THG, HQY, HSII, HELE, HP, HSIC, HUM, IBP, INTC, TILE, KBH, KEYS, LAMR, L, MGY, MAN, MCHX, MLM, MA, MTRN, MTRX, MGEE, MOS, MLI, MUR, MYGN, NWL, JWN, OMCL, PKG, PEN, PRFT, PCG, POR, PFG, PGR, DGX, RMBS, REGN, RGS, RNG, RCKY, ROG, SMG, SEE, SCI, STR, SWX, SWN, SXI, TGT, TPX, UNH, UNM, VFC, VMC, WLK, WMB, ZBRA, DDM, FXI, QQQ, IEV, ILF, EWA, EWJ, EPP, EWS, EWD, PHO, XLP, XLV, XLK, UNG, USO, VAW, MGK. Click this link for details (pattern type, start and end dates).
For a list of small patterns (those a few days wide) click this link.
$ $ $
You can find setups based on a Fibonacci retrace by clicking on the link.
The following patterns were found manually, not using Patternz. Mr. Bulkowski has excluded any securities he owns from appearing in the list. However, he may add any of the securities listed to his portfolio at any time, just as you can.
In the table below, the red and green colors are based on the historical breakout direction for the associated chart pattern. If a high and tight flag appears, the start and end dates highlight the flagpole only and not the flag.
For details about the chart patterns, click here.
-- Thomas Bulkowski, author: Invest for Two-Comma Wealth and Training "Miles" (#Ad) ![]()
![]()
| Symbol | Chart Pattern | Bullish Bearish | Start | End | Industry |
| AMD | Head-and-shoulders bottom | 04/19/2024 | 05/14/2024 | Semiconductor | |
| AFL | Pipe bottom | 04/08/2024 | 04/15/2024 | Insurance (Diversified) | |
| A | Pipe bottom | 04/15/2024 | 04/22/2024 | Precision Instrument | |
| AA | Double Bottom, Adam and Adam | 04/18/2024 | 05/01/2024 | Aerospace/Defense | |
| BIO | Triple bottom | 04/18/2024 | 05/09/2024 | Medical Supplies | |
| CF | Double Bottom, Adam and Adam | 05/02/2024 | 05/08/2024 | Chemical (Basic) | |
| CMTL | Double Bottom, Adam and Eve | 04/23/2024 | 05/09/2024 | Telecom. Equipment | |
| COST | Double Bottom, Adam and Adam | 04/03/2024 | 04/19/2024 | Retail Store | |
| CROX | Three Rising Valleys | 04/17/2024 | 05/01/2024 | Shoe | |
| DHR | Ugly double bottom | 04/18/2024 | 05/02/2024 | Medical Services | |
| FIVN | Double Top, Eve and Adam | 04/24/2024 | 05/03/2024 | Computer Software and Svcs | |
| FLEX | Roof, inverted | 04/04/2024 | 05/15/2024 | Electronics | |
| GD | Diamond bottom | 04/15/2024 | 05/02/2024 | Aerospace/Defense | |
| HE | Ugly double bottom | 04/16/2024 | 04/26/2024 | Electric Utility (West) | |
| HSIC | Pipe bottom | 04/29/2024 | 05/06/2024 | Medical Supplies | |
| HOV | Double Bottom, Adam and Eve | 03/18/2024 | 04/19/2024 | Homebuilding | |
| HUBG | Double Bottom, Eve and Adam | 04/18/2024 | 04/26/2024 | Trucking/Transp. Leasing | |
| HUM | Double Bottom, Adam and Eve | 04/02/2024 | 05/01/2024 | Medical Services | |
| INCY | Pipe bottom | 04/22/2024 | 04/29/2024 | Drug | |
| INTC | Double Bottom, Eve and Eve | 05/01/2024 | 05/08/2024 | Semiconductor | |
| IPAR | Double Bottom, Eve and Adam | 05/01/2024 | 05/08/2024 | Toiletries/Cosmetics | |
| IPG | Big W | 04/16/2024 | 05/02/2024 | Advertising | |
| INTU | Triangle, symmetrical | 04/19/2024 | 05/14/2024 | Computer Software and Svcs | |
| KSS | Ugly double bottom | 04/18/2024 | 05/01/2024 | Retail Store | |
| LRCX | Double Bottom, Eve and Adam | 04/22/2024 | 05/02/2024 | Semiconductor Cap Equip. | |
| MAN | Ugly double bottom | 04/16/2024 | 05/01/2024 | Human Resources | |
| MRK | Triangle, symmetrical | 03/27/2024 | 05/16/2024 | Drug | |
| NOC | Double Top, Adam and Adam | 04/25/2024 | 05/01/2024 | Aerospace/Defense | |
| NWPX | Pennant | 05/09/2024 | 05/15/2024 | Building Materials | |
| NUS | Double Bottom, Eve and Adam | 04/15/2024 | 04/30/2024 | Toiletries/Cosmetics | |
| NVDA | Pipe bottom | 04/15/2024 | 04/22/2024 | Semiconductor | |
| PAYX | Double Bottom, Adam and Adam | 04/18/2024 | 05/02/2024 | IT Services | |
| RMBS | Head-and-shoulders bottom | 04/19/2024 | 05/09/2024 | Semiconductor Cap Equip. | |
| RHI | Head-and-shoulders bottom | 04/17/2024 | 05/08/2024 | Human Resources | |
| SAIA | Triangle, symmetrical | 05/02/2024 | 05/16/2024 | Trucking/Transp. Leasing | |
| SXI | Broadening bottom | 04/10/2024 | 05/06/2024 | Diversified Co. | |
| SUM | Triple bottom | 04/19/2024 | 05/02/2024 | Cement and Aggregates | |
| TFX | Double Bottom, Eve and Adam | 05/02/2024 | 05/08/2024 | Diversified Co. | |
| TTD | Double Bottom, Eve and Adam | 03/15/2024 | 04/22/2024 | Advertising | |
| TMO | Ugly double bottom | 04/18/2024 | 05/07/2024 | Precision Instrument | |
| TREX | Diamond bottom | 04/18/2024 | 05/16/2024 | Building Materials | |
| UNH | Ugly double bottom | 04/12/2024 | 05/01/2024 | Medical Services | |
| VMC | Double Bottom, Adam and Adam | 04/19/2024 | 04/25/2024 | Cement and Aggregates | |
| WAT | Pipe bottom | 04/15/2024 | 04/22/2024 | Precision Instrument | |
| FDN | Double Bottom, Adam and Adam | 04/19/2024 | 04/25/2024 | Internet | |
| SOXX | Pipe bottom | 04/15/2024 | 04/22/2024 | Semiconductor | |
| IHI | Roof, inverted | 04/24/2024 | 05/10/2024 | Medical Supplies |
![]()
Since I post this the night before, check how the futures are trading before market open. Large moves can affect the opening direction.
$ $ $
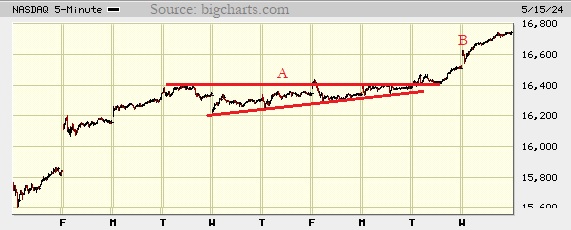
I show a picture of the Nasdaq composite on the 5-minute scale.
At first glance, there wasn't a lot going on in this picture. However, after gluing on a few trendlines, a chart pattern emerges.
At A, an ascending triangle appears. Those have horizontal tops and up-sloping bottoms. They can break out in either direction, but is upward 63% of the time.
An upward breakout happened here. At B, the index gapped open higher, perhaps on favorable news about inflation. I think it looks good for additional rises, especially after going horizontal for a week.
$ $ $
I updated the 10-year forecast for the Dow industrials, Nasdaq composite, and S&P 500. click the link to see the pictures.
$ $ $
Here's a symbol list of 216 chart and candlestick patterns (13 "investment grade" candle patterns) found in today's securities using my version of Patternz: DDD, ADTN, AEIS, AES, A, ALB, ALGT, DOX, AMED, AEE, AEO, AME, AMGN, APH, ANIK, AMAT, ARCB, ANET, BALL, BSET, BECN, BZH, BERY, BBY, BIO, BIIB, BOOT, BMY, BRKR, BLDR, BG, CBT, CI, CONN, CROX, CCK, CMI, DECK, DVN, FANG, DDS, EXP, EBAY, EFX, EXC, EXPI, FICO, FIS, FE, FLS, FORM, FTNT, GME, GIS, GPN, GMS, GPRO, GES, THG, HELE, HP, HSIC, DHI, HOV, IDXX, IBP, ITGR, IPAR, TILE, INTU, IRM, JBLU, KBH, KMT, KEYS, KLAC, LEN, LLY, LMT, MHO, MGY, MAN, MKTX, MAS, MA, MTRN, MGEE, MU, MLI, MUR, MYGN, NBR, ^IXIC, NWL, NEE, NI, JWN, NOC, NOVT, NUS, OXY, OMCL, OR, PYPL, PEN, PCG, PPL, PEG, PHM, QCOM, REGN, RGS, ^GSPC, CRM, SBH, SLB, SCHW, SMG, SEIC, STR, SKX, SMAR, SWX, SWN, SR, SUM, SNPS, TRGP, TDY, TFX, TER, TXN, TKR, TOL, TZOO, TG, UHAL, UNH, VLO, VECO, MDRX, V, VMC, WLK, WMB, IAI, IHE, IDU, DDM, FTEC, QTEC, FXL, QQQ, ICF, IYH, IAT, IEV, IGV, MXI, IXN, SOXX, SLV, IEO, IYF, ITB, EWK, EEM, EWG, EIS, EWI, EWM, EWW, EZA, EWY, EWP, EWD, EWL, EWT, EWU, QLD, IBB, PBE, PHO, SSO, XLF, XLV, XHB, XLB, SPY, XLK, XLU, USO, SMH, VHT, VAW, MGK, VONG. Click this link for details (pattern type, start and end dates).
For a list of small patterns (those a few days wide) click this link.
$ $ $
The following table shows where Fibonacci retrace values of the day's high-low range are plus pivot points, calculated on the Nasdaq composite, sorted by value. When several are near each other (small differences), the area might act as support or resistance.
-- Thomas Bulkowski, author: Invest for Two-Comma Wealth and Training "Miles" (#Ad) ![]()
![]()
| © 2024 ThePatternSite.com Metric | Value | Diff | Close (within 10% of the high-low range for the day)? |
| Monthly S2 | 14,901.44 | ||
| Monthly S1 | 15,821.91 | 920.48 | |
| Monthly Pivot | 16,143.26 | 321.34 | |
| Weekly S2 | 16,219.68 | 76.43 | |
| Weekly Pivot | 16,459.21 | 239.53 | |
| Daily S2 | 16,473.09 | 13.88 | Yes! The Daily S2 is close to the Weekly Pivot. |
| Weekly S1 | 16,481.04 | 7.95 | Yes! The Weekly S1 is close to the Daily S2. |
| Low | 16,544.09 | 63.05 | |
| Open | 16,601.14 | 57.05 | |
| Daily S1 | 16,607.74 | 6.60 | Yes! The Daily S1 is close to the Open. |
| 61.8% Down from Intraday High | 16,622.65 | 14.91 | Yes! The 61.8% Down from Intraday High is close to the Daily S1. |
| 50% Down from Intraday High | 16,646.91 | 24.27 | |
| 38.2% Down from Intraday High | 16,671.18 | 24.27 | |
| Daily Pivot | 16,678.74 | 7.56 | Yes! The Daily Pivot is close to the 38.2% Down from Intraday High. |
| Weekly R2 | 16,698.74 | 20.00 | Yes! The Weekly R2 is close to the Daily Pivot. |
| Weekly R1 | 16,720.57 | 21.82 | |
| Close | 16,742.39 | 21.82 | |
| High | 16,749.74 | 7.35 | Yes! The High is close to the Close. |
| Daily R1 | 16,813.39 | 63.65 | |
| Daily R2 | 16,884.39 | 71.00 | |
| Monthly R1 | 17,063.73 | 179.34 | |
| Monthly R2 | 17,385.08 | 321.34 |
Support this site! Clicking any of the books (below) takes you to
Amazon.com If you buy ANYTHING while there, they pay for the referral.
Legal notice for paid links: "As an Amazon Associate I earn from qualifying purchases."
|
My Stock Market Books
|
My Novels
|

