As of 04/20/2026
Indus: 49,443 -4.87 0.0%
Trans: 23,322 +900.05 +4.0%
Utils: 1,152 -6.38 -0.6%
Nasdaq: 24,404 -64.09 -0.3%
S&P 500: 7,109 -16.92 -0.2%
|
YTD
+2.9%
+34.4%
+7.8%
+5.0%
+3.9%
|
|
As of 04/20/2026
Indus: 49,443 -4.87 0.0%
Trans: 23,322 +900.05 +4.0%
Utils: 1,152 -6.38 -0.6%
Nasdaq: 24,404 -64.09 -0.3%
S&P 500: 7,109 -16.92 -0.2%
|
YTD
+2.9%
+34.4%
+7.8%
+5.0%
+3.9%
|
|
As of 04/20/2026
Indus: 49,443 -4.87 0.0%
Trans: 23,322 +900.05 +4.0%
Utils: 1,152 -6.38 -0.6%
Nasdaq: 24,404 -64.09 -0.3%
S&P 500: 7,109 -16.92 -0.2%
|
YTD
+2.9%
+34.4%
+7.8%
+5.0%
+3.9%
| |
|
| ||
For more information on this pattern, read Encyclopedia of Chart Patterns, 3rd Edition (#ad).
If you click on the above link and then buy the book (or anything) while at Amazon.com, the referral will help support this site. Thanks.
$ $ $
Updated and added 10 examples on 7/31/25.
Diamond tops with upward breakouts in a bull market rank last for performance. Like diamonds bottoms, the top variety (with downward breakouts) can show a fast decline post breakout if a quick rise preceded the diamond reversal. The crash site (downtrend end) is often near the price level of the launch site (uptrend start). The below diamond top figure shows an example of this quick-rise quick-decline feature.
|
Diamond Top
|
|
The above numbers are based on 733 perfect trades. See the glossary for definitions.
| Characteristic | Discussion |
| Price trend | Upward leading to the pattern. |
| Shape | Looks like a diamond, but one usually tilted to the side. |
| Trendlines | Prices form higher peaks and lower valleys (a broadening pattern) in the first part of the pattern, then price action narrows with lower peaks and higher valleys (symmetrical triangle). Trendlines connect the peaks and valleys for a diamond shape. |
| Touches | Prices will touch each trendline once or twice. Don't worry if your lines cross some of the price outliers. |
| Volume trend | Downward trend 55% to 59% of the time. |
| Breakout | Downward 54% of the time. |
![]() More (#ad)
More (#ad)
Consult the associated figure on the right.
| Trading Tactic | Explanation | 
The Measure Rule

Price Trend

Half Staff
|
| Measure rule | See the measure rule figure to the right. Compute the height from the highest peak (A) to the lowest valley (B) in the pattern and then multiply it by the above 'percentage meeting price target.' Add it (upward breakouts) or subtract it (downward breakouts) from the breakout price (the blue line) to get the price target (C). | |
| Price trend | See the price trend figure to the right. If price makes a quick, nearly vertical rise (A) leading to the diamond and the breakout is downward, expect price to drop back to the price at which it started (B) the rise. However, the drop won't be as fast. Also, price must have something to reverse. Diamonds with short-term (less than three months) or intermediate-term (three to six months) price trends leading to the diamond perform best post breakout (depending on the breakout direction). | |
| Half staff | See the half staff figure to the right. If the diamond acts as a continuation pattern, meaning that price exits (C to D) in the same direction as it entered the pattern (A to B), then the diamond can act as a half-staff pattern (half the move is still ahead). The move after the breakout (CD) will often fall short, so look for overhead resistance where price might stall. | |
| Price velocity | High velocity moves after the pattern often follow high velocity moves leading to the pattern. | |
| Yearly low | For best performance, diamonds with breakouts in the lowest third of the yearly price range perform best. | |
| Volume trend | A rising volume trend (upward breakouts) results in the best post breakout performance. | |
| Throwbacks and pullbacks | Throwbacks and pullbacks hurt post breakout performance. |
![]() More (#ad)
More (#ad)

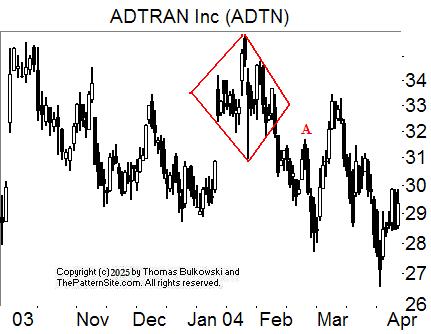
The above figure shows an example of a diamond top chart pattern. Price begins the rise at point A and then forms the diamond top. The breakout from this diamond top is downward but it does not last long. Price pulls back and busts the diamond when price closes above the top of the diamond top chart pattern. The rise is also short and price plunges, stopping at B, near the launch price of A.
![]() More (#ad)
More (#ad)
The following is a slide show. Click the right or left arrows, or the circles below the chart to navigate around the slides.

A chart of a diamond top with a downward breakout. The downward breakout busts when price doesn't drop far before reversing and closing above the top of the diamond.

This is an example of a double busted diamond top with an upward breakout. Price breaks out upward, drops to B (busting the upward breakout) before recovering to bust the downward move (B).

Another example of a diamond top.

Here are two examples of diamond tops. Often I ignore overshoot where price rises slightly above the start of the chart pattern before easing down into it. The diamond on the left is an example.

This diamond top sees the price at B almost return to launch price A.

A single busted diamond top. The breakout is downward at A, and when price rises to close above the top of the diamond at B, it busts the downward breakout.

This diamond top breaks out downward (A), rises to B but fails to close above the top of the diamond, so it doesn't bust the downward breakout until later.

A diamond top.

This diamond appears about midway in the AB run.
-- Thomas Bulkowski
![]() More (#ad)
More (#ad)
Support this site! Clicking any of the books (below) takes you to
Amazon.com If you buy ANYTHING while there, they pay for the referral.
Legal notice for paid links: "As an Amazon Associate I earn from qualifying purchases."
|
My Stock Market Books
|
My Novels
Orb Foresight Rewrite Coming!
|
Madness takes its toll. Please have exact change.![]()