As of 04/20/2026
Indus: 49,443 -4.87 0.0%
Trans: 23,322 +900.05 +4.0%
Utils: 1,152 -6.38 -0.6%
Nasdaq: 24,404 -64.09 -0.3%
S&P 500: 7,109 -16.92 -0.2%
|
YTD
+2.9%
+34.4%
+7.8%
+5.0%
+3.9%
|
|
As of 04/20/2026
Indus: 49,443 -4.87 0.0%
Trans: 23,322 +900.05 +4.0%
Utils: 1,152 -6.38 -0.6%
Nasdaq: 24,404 -64.09 -0.3%
S&P 500: 7,109 -16.92 -0.2%
|
YTD
+2.9%
+34.4%
+7.8%
+5.0%
+3.9%
|
|
As of 04/20/2026
Indus: 49,443 -4.87 0.0%
Trans: 23,322 +900.05 +4.0%
Utils: 1,152 -6.38 -0.6%
Nasdaq: 24,404 -64.09 -0.3%
S&P 500: 7,109 -16.92 -0.2%
|
YTD
+2.9%
+34.4%
+7.8%
+5.0%
+3.9%
| |
|
| ||
Updated and added 10 examples on 7/25/25.
For more information on this pattern, read Encyclopedia of Chart Pattern, 3rd Edition. The associated chapter gives a complete review of the chart pattern, compared to what is described below.

The above numbers are based on 913 perfect trades. See the glossary for definitions.
| Characteristic | Discussion |
| Price trend | Price rises into the start of the cup, but I don't pay much attention to this guideline. |
| Shape | A rounded turn that looks like a cup with a handle on the right of the cup. |
| U-shaped cup | The cup should be U-shaped, not V-shaped, but allow variations. |
| Handle | The cup must have a handle on the right. |
| Cup duration | From 7 to 65 weeks (allow variations). |
| Handle | 1 week minimum with no maximum, forming in the upper half of the cup. |
| Cup | Cup rims should be near the same price level but be flexible. |
Consult the associated figure on the right.
| Trading Tactic | Explanation | 
The Measure Rule
|
| Measure rule | Measure the height from the right cup lip (A) to the lowest valley (B) then multiply by the above 'percentage meeting price target.' Add the result to the breakout price (A) to get a target. | |
| Inner cup | Cups often form within cups (points 1 and 2), so trade the inner cup when price rises above the handle (the dashed green line at point 3). | |
| Trendline | If possible, draw a down-sloping trendline along the handle peaks. A close above the trendline signals an early buy. I show this as the blue line extending down from point A on the chart to the right. | |
| Buy | If a trendline entry is not available, buy when price closes above the right cup rim (point A, and the top horizontal red line). | |
| Stop | The handle low (point C) is a good place to put a stop. Raise the stop as price rises. | |
| Throwbacks | Throwbacks hurt performance. | |
| Short handle | Stocks with handles shorter than the median 22 days show superior post breakout performance. |

The figure on the right shows an example of a cup with handle chart pattern. The rise leading to the cup with handle begins at C and reaches the left cup lip at point A. Since this is on the weekly scale, the price chart appears narrower than usual, but price rounds downward forming a cup with the right cup lip at B. The handle lasts a few weeks before price begins moving up. The next week, price rockets upward about seven points.
I looked at 300 cup with handle patterns, stretching from 1990 to March 2024. For this lesson, I used Patternz's List form to find that a significant retrace happens after the handle shows an upward breakout. I found that 47% of the cup with handle patterns dropped substantially within two months of the breakout.
I present the information in slider format, so be sure to click the left or right arrows to view another slide.

After the cup with handle confirmed as a valid chart pattern, Valaris (VAL) coughed up a fur ball at A. The stock plummeted down to B, busting the upward breakout.

This is a chart of Williams-Sonoma (WSM) on the daily scale. The cup with handle breaks out upward and the stock rises to A before retracing to B. It might not look like a big drop but it measures 15%.

This is a more recent example (Alarm.com Holdings) of the drop after the cup breaks out upward. The breakout is at A and price drops to B. This is from 2023.

I show this (Allstate) to illustrate how price can rise for a time before plunging. The horizontal green line shows the handle. The pattern confirms as valid when price closes above the line (A). After that, the stock retraces back to the thin blue line (about midway down the handle) before rising to B. Then we see the drop to C.
The following is a slide show. Click the right or left arrows, or the circles below the chart to navigate around the slides.
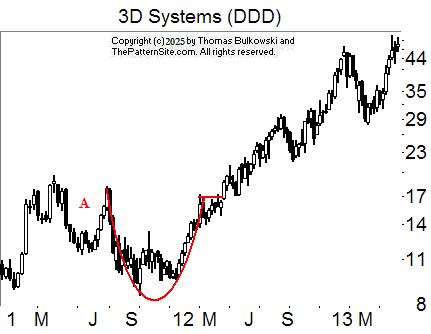
A cup with handle pattern appears here, outlined in red. At A, a rounded turn has a downward breakout, so it's not a cup (plus, it doesn't have a handle). Weekly scale.

A cup with handle chart pattern, daily scale.

A rough-looking cup bottom with handle chart pattern. This is on the weekly scale, so the handle (A) appears short.

A cup with handle chart pattern on the daily scale.

A cup with handle chart pattern, weekly scale.

A cup with handle chart pattern, daily chart.

A cup with handle chart pattern, weekly scale, that sees price climb to the ultimate high at A. The ultimate high is the highest peak reached before price drops at least 10%.

Another cup with handle chart pattern, weekly scale.

Another cup with handle chart pattern, weekly scale. Point A shows the ultimate high.

Another cup with handle chart pattern, weekly scale.
-- Thomas Bulkowski
Support this site! Clicking any of the books (below) takes you to
Amazon.com If you buy ANYTHING while there, they pay for the referral.
Legal notice for paid links: "As an Amazon Associate I earn from qualifying purchases."
|
My Stock Market Books
|
My Novels
Orb Foresight Rewrite Coming!
|
Your dreams have been answered. I'm here.![]()