
As of 03/16/2026
Indus: 46,946 +387.94 +0.8%
Trans: 17,854 +121.79 +0.7%
Utils: 1,187 +6.45 +0.5%
Nasdaq: 22,374 +268.82 +1.2%
S&P 500: 6,699 +67.19 +1.0%
|
YTD
-2.3%
+2.9%
+11.1%
-3.7%
-2.1%
|
|
As of 03/16/2026
Indus: 46,946 +387.94 +0.8%
Trans: 17,854 +121.79 +0.7%
Utils: 1,187 +6.45 +0.5%
Nasdaq: 22,374 +268.82 +1.2%
S&P 500: 6,699 +67.19 +1.0%
|
YTD
-2.3%
+2.9%
+11.1%
-3.7%
-2.1%
| |
|
| ||
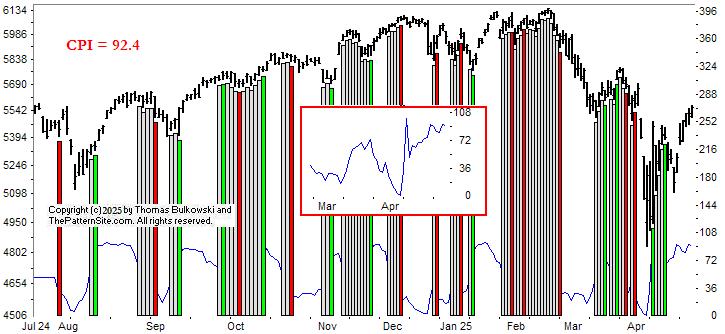
This is a picture of the chart pattern indicator on the daily scale. The indicator is the line chart below a chart of the S&P 500 composite.
The most recent signal change happened about two weeks ago when the indicator cycled from neutral to bullish. Bullish is the green vertical bar on the far right of the chart.
You can see the CPI line but it's highlighted in the inset, which is that blob in the middle of the chart. It shows the indicator gaining altitude at a steady clip. But there's a problem.
The scale for the indicator goes from 0 to 100 and the current reading is 92.4. There's not a lot to climb before it hits max.
What this tells me is to expect a retrace soon. How soon? Days to one week, but probably not more. It can't say how far the index will retrace either. All of this is just a guess, so keep that in mind.
If you're a Elliott Waver, then I believe we went through an ABC correction (from chart peak to April low). So now could be wave 1 or 3, heading for a 5 wave push upward. That means a rise, retrace, (already happened) rise (in progress), retrace, and rise. Unless it decides to extend another retrace rise pair.
$ $ $
Here's a symbol list of 141 chart and candlestick patterns (13 "investment grade" candle patterns) found in today's securities using my version of Patternz: ACN, ALRM, ALK, ALGT, AEO, AMWD, AME, AON, ARCB, ADP, AVY, AVNT, BMI, BCPC, BMRN, BKH, BR, CDNS, CALM, CPB, CENX, CHKP, CINF, CLNE, CLX, CMTL, CXW, CR, CROX, CCK, CW, ^DJU, EXP, EME, EFX, FFIV, FARO, FIVN, FTV, FDP, GIS, GILD, HQY, HELE, HNI, HD, HON, HUM, JBHT, IDXX, ITW, NSP, ITGR, IBKR, K, KFRC, LH, LANC, RAMP, LPLA, MANH, MAN, MAS, MA, MDT, META, MCO, MS, ^IXIC, NOVT, NUS, OTEX, ORCL, PTEN, PAYX, PCTY, PFG, PG, PEG, PSTG, QTWO, RJF, RTX, RGS, RNG, RCKY, ROST, RGLD, ^GSPC, CRM, SKYW, SXI, TGT, TECH, TSCO, TRV, TWLO, UIS, UNH, MDRX, WERN, WPM, WSM, WOLF, ZBRA, IAI, IYC, FTEC, FDN, BOTZ, QQQ, IYH, IGV, MXI, SLV, IHI, EWO, EWI, EWY, EWL, EWT, THD, TUR, QLD, SSO, ROBO, XLY, XLV, SPY, XAR, XLK, UNG, VHT, MGK, VONG. Click this link for details (pattern type, start and end dates).
For a list of small patterns (those a few days wide) click this link.
-- Thomas Bulkowski
![]()
$ $ $
I show another slider trading quiz featuring Tribune Co. 2: TRB stock.
$ $ $
Here's a symbol list of 92 chart and candlestick patterns (13 "investment grade" candle patterns) found in today's securities using my version of Patternz: ADBE, AEE, AEO, AMN, AAPL, ARW, ADSK, BA, BFH, BR, CALM, CPB, CF, CLF, CNX, CGNX, CMTL, ED, CSGP, CROX, CSGS, CMI, DHR, EXP, EBAY, EME, EQT, FFIV, FARO, FIS, FIVN, FMC, HNI, HUM, NSP, IPI, JAZZ, K, MRK, NEU, NI, NOVT, PTEN, PPL, PHM, ROK, RCKY, RGLD, SAIA, SBH, SEIC, NOW, STR, TDOC, TSCO, TZOO, UHAL, UIS, UNH, VEEV, WMB, WSC, WOLF, WWW, IDU, QTEC, FXL, MXI, IXN, ILF, IEO, EWK, EWZ, ECH, EWG, EWI, EWJ, EWM, EWS, EZA, EWP, EWL, EWU, PJP. Click this link for details (pattern type, start and end dates).
For a list of small patterns (those a few days wide) click this link.
$ $ $
The following table shows where Fibonacci retrace values of the day's high-low range are plus pivot points, calculated on the Dow industrials, sorted by value. When several are near each other (small differences), the area might act as support or resistance.
-- Thomas Bulkowski
![]()
| © 2025 ThePatternSite.com Metric | Value | Diff | Close (within 10% of the high-low range for the day)? |
| Monthly S2 | 33,677.02 | ||
| Weekly S2 | 36,932.67 | 3,255.66 | |
| Monthly S1 | 36,952.30 | 19.63 | Yes! The Monthly S1 is close to the Weekly S2. |
| Weekly S1 | 38,580.13 | 1,627.82 | |
| Weekly Pivot | 39,478.12 | 897.99 | |
| Daily S2 | 39,625.21 | 147.09 | |
| Low | 39,869.10 | 243.89 | |
| Monthly Pivot | 39,887.07 | 17.96 | Yes! The Monthly Pivot is close to the Low. |
| Daily S1 | 39,926.40 | 39.33 | Yes! The Daily S1 is close to the Monthly Pivot. |
| 61.8% Down from Intraday High | 40,077.32 | 150.92 | |
| 50% Down from Intraday High | 40,141.64 | 64.32 | |
| Daily Pivot | 40,170.29 | 28.65 | Yes! The Daily Pivot is close to the 50% Down from Intraday High. |
| Open | 40,171.74 | 1.45 | Yes! The Open is close to the Daily Pivot. |
| 38.2% Down from Intraday High | 40,205.96 | 34.22 | Yes! The 38.2% Down from Intraday High is close to the Open. |
| Close | 40,227.59 | 21.63 | Yes! The Close is close to the 38.2% Down from Intraday High. |
| High | 40,414.18 | 186.59 | |
| Daily R1 | 40,471.48 | 57.30 | |
| Daily R2 | 40,715.37 | 243.89 | |
| Weekly R1 | 41,125.58 | 410.21 | |
| Weekly R2 | 42,023.57 | 897.99 | |
| Monthly R1 | 43,162.35 | 1,138.78 | |
| Monthly R2 | 46,097.12 | 2,934.77 |
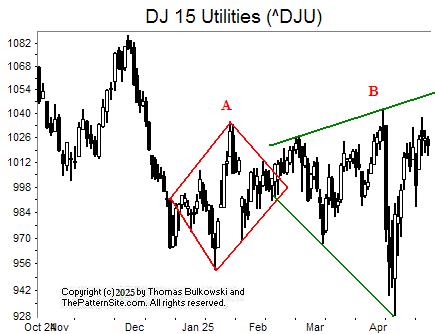
I show two chart patterns in Christmas colors, on the daily scale.
The first is A, red, which is a diamond bottom. This example has an upward breakout when price closes outside the north-east trendline. The index doesn't rise much afterward, though.
The second pattern is in green, at B. It's a broadening top because price enters the pattern from the bottom. This example as three touches on the bottom but falls one short of that on the top (measured by minor highs and minor lows, and not by individual price bar touches).
So, it's not ideal.
I am looking for the indices to calm down because I believe Trump is surrendering in his tariff war(s). I expect the index to rise to touch the top trendline. Of course, it's a weekend, and Trump will push things around on something or other. Overall, I'm expecting the markets to recover.
![]()
The following is a brief review of how the markets performed over time. The numbers refer to the close-to-close move in the Dow industrials.
No options expire this week.
![]()
The following is based on an SFO article in December 2004 by John Seekinger, titled, "Take a two-dimensional approach." He offers these tips.
| Index | S2 | S1 | Pivot | R1 | R2 |
| Dow Industrials (^DJI): Daily | 39,571 | 39,842 | 39,990 | 40,261 | 40,408 |
| Weekly | 36,895 | 38,504 | 39,440 | 41,050 | 41,986 |
| Monthly | 33,639 | 36,876 | 39,849 | 43,086 | 46,059 |
| S&P500 (^GSPC): Daily | 5,431 | 5,478 | 5,503 | 5,550 | 5,575 |
| Weekly | 4,959 | 5,242 | 5,385 | 5,668 | 5,811 |
| Monthly | 4,430 | 4,978 | 5,382 | 5,930 | 6,334 |
| Nasdaq (^IXIC): Daily | 17,006 | 17,194 | 17,299 | 17,488 | 17,593 |
| Weekly | 15,105 | 16,244 | 16,824 | 17,963 | 18,543 |
| Monthly | 13,319 | 15,351 | 16,816 | 18,848 | 20,313 |
Here are the formulas:
![]()
Earnings season is either underway or should be starting soon. The sessions could be more volatile.
Here's a symbol list of 62 chart and candlestick patterns (13 "investment grade" candle patterns) found in today's securities using my version of Patternz: AMN, AON, APOG, AMAT, ANET, BMY, CACI, CALM, CPB, CNC, CLNE, CNX, ED, EBAY, EME, EVRG, FICO, FISV, GD, GOOGL, GPRO, HLIT, HUM, INCY, IPAR, IPI, K, LMT, META, MUR, PCG, PLXS, RRC, RLI, SAIA, SHOP, STR, SO, TREX, UNH, VRSN, IDU, FDN, BOTZ, IHF, EWK, EWZ, EWG, EWI, EZA, EWP, EWU, DBA, XLU, USO. Click this link for details (pattern type, start and end dates).
For a list of small patterns (those a few days wide) click this link.
The below industries were the best (rank 1) or worst performing of those I follow.
|
-- Thomas Bulkowski
![]()
Here's a symbol list of 114 chart and candlestick patterns (13 "investment grade" candle patterns) found in today's securities using my version of Patternz: ABT, AKAM, AEE, AXP, AIG, AMWD, APA, ADM, AIZ, AGO, ADP, AVY, BMI, BCPC, BERY, BA, BRKR, BG, CACI, CALM, CSCO, CNO, CTSH, CMCO, CMTL, CAG, GLW, CSGP, COTY, ^DJT, ^DJI, DOV, EXP, EME, EMR, EL, FARO, FDX, FTNT, FTV, GAP, IT, GL, GS, THG, HUBG, HUM, JBHT, IEX, IIIN, IPI, IRM, JBLU, LAMR, LNC, RAMP, MLM, MRCY, META, MS, MLI, NOV, NEU, JWN, ORI, ON, PCTY, PCG, PFG, PG, PGR, RGA, ROL, RES, SAIA, SIGI, NOW, SHOP, STR, LUV, SRDX, TXN, TXT, TG, UPS, UNH, MDRX, VMC, WMT, WSM, WSC, IYC, DDM, IAT, IYZ, IYF, EWK, EEM, EWI, EWS, EWY, EWP, EWT, DBA, PJP, ROBO, XLY, XLF, XLI, UNG, VIS. Click this link for details (pattern type, start and end dates).
For a list of small patterns (those a few days wide) click this link.
$ $ $
You can find setups based on a Fibonacci retrace by clicking on the link.
The following patterns were found manually, not using Patternz. Mr. Bulkowski has excluded any securities he owns from appearing in the list. However, he may add any of the securities listed to his portfolio at any time, just as you can.
In the table below, the red and green colors are based on the historical breakout direction for the associated chart pattern. If a high and tight flag appears, the start and end dates highlight the flagpole only and not the flag.
For details about the chart patterns, click here.
-- Thomas Bulkowski, author: Invest for Two-Comma Wealth and the novel (fiction), Foresight (#Ad)
![]()
| Symbol | Chart Pattern | Bullish Bearish | Start | End | Industry |
| ABM | Ugly double bottom | 04/09/2025 | 04/21/2025 | Industrial Services | |
| APH | Pipe bottom | 03/31/2025 | 04/07/2025 | Electronics | |
| ARW | Pipe bottom | 03/31/2025 | 04/07/2025 | Electronics | |
| ADSK | Head-and-shoulders bottom | 03/13/2025 | 04/21/2025 | Computer Software and Svcs | |
| BMI | Pipe bottom | 03/31/2025 | 04/07/2025 | Precision Instrument | |
| BA | Pipe bottom | 03/31/2025 | 04/07/2025 | Aerospace/Defense | |
| BKNG | Head-and-shoulders bottom | 03/13/2025 | 04/21/2025 | Internet | |
| BCO | Broadening bottom | 03/10/2025 | 04/09/2025 | Industrial Services | |
| BG | Double Bottom, Eve and Adam | 02/06/2025 | 04/09/2025 | Food Processing | |
| CDNS | Ugly double bottom | 04/07/2025 | 04/21/2025 | Computer Software and Svcs | |
| CPB | Pipe top | 03/03/2025 | 03/10/2025 | Food Processing | |
| CLS | Pipe bottom | 03/31/2025 | 04/07/2025 | Electronics | |
| CENX | Ugly double bottom | 04/09/2025 | 04/21/2025 | Metals and Mining (Div.) | |
| CDAY | Ugly double bottom | 04/07/2025 | 04/21/2025 | Information Services | |
| CGNX | Double Bottom, Eve and Adam | 04/09/2025 | 04/21/2025 | Precision Instrument | |
| CXW | Pipe bottom | 03/31/2025 | 04/07/2025 | Industrial Services | |
| CSGP | Pipe bottom | 03/31/2025 | 04/07/2025 | Information Services | |
| DFS | Pipe bottom | 03/31/2025 | 04/07/2025 | Financial Services | |
| FFIV | Head-and-shoulders bottom | 03/13/2025 | 04/21/2025 | Internet | |
| FICO | Pipe bottom | 03/31/2025 | 04/07/2025 | IT Services | |
| FIS | Double Bottom, Adam and Eve | 03/12/2025 | 04/09/2025 | Computer Software and Svcs | |
| FTNT | Ugly double bottom | 04/07/2025 | 04/22/2025 | Computer Software and Svcs | |
| FNV | Pipe bottom | 03/31/2025 | 04/07/2025 | Metals and Mining (Div.) | |
| FDP | Double Bottom, Eve and Adam | 03/25/2025 | 04/09/2025 | Food Processing | |
| IT | Ugly double bottom | 04/07/2025 | 04/21/2025 | IT Services | |
| GES | Double Bottom, Adam and Eve | 04/09/2025 | 04/16/2025 | Apparel | |
| HSII | Pipe top | 03/03/2025 | 03/10/2025 | Human Resources | |
| ILMN | Double Bottom, Eve and Adam | 04/09/2025 | 04/21/2025 | Biotechnology | |
| IIIN | Pipe bottom | 03/31/2025 | 04/07/2025 | Building Materials | |
| MLM | Ugly double bottom | 04/09/2025 | 04/21/2025 | Cement and Aggregates | |
| MOS | Pipe bottom | 03/31/2025 | 04/07/2025 | Chemical (Diversified) | |
| NFLX | Pipe bottom | 03/31/2025 | 04/07/2025 | Internet | |
| NEU | Double Bottom, Adam and Adam | 03/13/2025 | 04/08/2025 | Chemical (Specialty) | |
| NWPX | Triangle, ascending | 04/02/2025 | 04/24/2025 | Building Materials | |
| PANW | Ugly double bottom | 04/07/2025 | 04/21/2025 | Computer Software and Svcs | |
| PAYX | Pipe top | 03/24/2025 | 03/31/2025 | IT Services | |
| PETS | Scallop, descending | 03/31/2025 | 04/24/2025 | Medical Services | |
| SAIC | Ugly double bottom | 03/03/2025 | 03/21/2025 | IT Services | |
| NOW | Ugly double bottom | 04/07/2025 | 04/21/2025 | IT Services | |
| SWX | Pipe bottom | 03/31/2025 | 04/07/2025 | Natural Gas (Distributor) | |
| UNH | Pipe top | 04/07/2025 | 04/14/2025 | Medical Services | |
| VEEV | Double Bottom, Eve and Adam | 04/07/2025 | 04/21/2025 | Healthcare Information | |
| WPM | Pipe bottom | 03/31/2025 | 04/07/2025 | Metals and Mining (Div.) |
![]()
$ $ $

I show a picture of the Nasdaq composite on the 5-minute scale.
The green line is a trendline drawn along price bottoms (valleys). The index pierces the line and attempts a pullback to the trendline but doesn't quite make it.
Labeled in red is another chart pattern called a head-and-shoulders bottom. RS is the right shoulder and LS is the left. It confirms as a valid pattern when the index closes above the red line. That happens when the index gapped up at the open on Wednesday.
Now, it looks like it's attempting a throwback, which is similar to a pullback, except it happens on top of the pattern when price drops to the breakout price.
What does this mean? It suggests a bit more of a decline followed by a resumption of the upward move.
$ $ $
Here's a symbol list of 110 chart and candlestick patterns (13 "investment grade" candle patterns) found in today's securities using my version of Patternz: ABT, AEIS, ANIK, APA, AAPL, AMAT, ADM, ARW, AVNT, BECN, BIO, BMRN, BA, BAH, BCO, BR, BBW, CALM, CLS, COR, CHKP, CGNX, CAG, GLW, COTY, CSGS, CW, XRAY, DFS, DSGR, EL, EXPI, EZPW, FAST, FLEX, FCX, GE, GPRO, HE, HUM, IDXX, ILMN, IBP, INTC, IPI, KFRC, KMB, KLIC, LZB, LEG, LMT, MTDR, MUR, NEU, OLN, OMCL, ON, PATK, PCG, PPL, QTWO, RL, ROK, ROL, RES, R, SBH, SAIC, SRE, STR, SCCO, TPR, TECH, TEVA, TKR, TOL, TRV, UNH, VFC, WSO, WERN, WSM, IYC, IEZ, QTEC, FXI, ICF, ILF, SOXX, EWK, EWZ, ECH, EEM, EWQ, EWG, EWH, EWJ, EWM, EWW, EWS, EWY, EWU, IBB, PBE, GLD. Click this link for details (pattern type, start and end dates).
For a list of small patterns (those a few days wide) click this link.
$ $ $
The following table shows where Fibonacci retrace values of the day's high-low range are plus pivot points, calculated on the Nasdaq composite, sorted by value. When several are near each other (small differences), the area might act as support or resistance.
-- Thomas Bulkowski
![]()
| © 2025 ThePatternSite.com Metric | Value | Diff | Close (within 10% of the high-low range for the day)? |
| Monthly S2 | 13,093.97 | ||
| Monthly S1 | 14,901.01 | 1,807.04 | |
| Weekly S2 | 15,566.93 | 665.92 | |
| Weekly S1 | 16,137.49 | 570.56 | |
| Daily S2 | 16,406.32 | 268.83 | |
| Daily S1 | 16,557.19 | 150.86 | |
| Monthly Pivot | 16,591.07 | 33.88 | Yes! The Monthly Pivot is close to the Daily S1. |
| Weekly Pivot | 16,637.02 | 45.95 | |
| Low | 16,642.66 | 5.64 | Yes! The Low is close to the Weekly Pivot. |
| Close | 16,708.05 | 65.39 | |
| 61.8% Down from Intraday High | 16,790.57 | 82.52 | |
| Daily Pivot | 16,793.52 | 2.95 | Yes! The Daily Pivot is close to the 61.8% Down from Intraday High. |
| 50% Down from Intraday High | 16,836.26 | 42.74 | |
| Open | 16,880.29 | 44.03 | |
| 38.2% Down from Intraday High | 16,881.95 | 1.66 | Yes! The 38.2% Down from Intraday High is close to the Open. |
| Daily R1 | 16,944.39 | 62.44 | |
| High | 17,029.86 | 85.47 | |
| Daily R2 | 17,180.72 | 150.86 | |
| Weekly R1 | 17,207.58 | 26.86 | Yes! The Weekly R1 is close to the Daily R2. |
| Weekly R2 | 17,707.11 | 499.53 | |
| Monthly R1 | 18,398.11 | 691.00 | |
| Monthly R2 | 20,088.17 | 1,690.06 |

This is a picture of the chart pattern indicator on the daily scale. The indicator is the line chart below a chart of the S&P 500 composite.
Lots of green (bullish) signals appear on the far right of the chart. The large daily swings have pushed the CPI from neutral to bullish and back again regularly. Neutral is a white bar. If you look closely, there are four neutral and three bullish bars in the last week or so.
The current reading, as I post this, is 98.1 with 100 being the max and 0 is the min.
The inset on the far left of the chart shows the indicator line.
Usually I'd say that the CPI can't rise much farther (meaning, it can drop a lot), but the index can rise. It could peg the CPI at scale top and the index could return to old highs. All of this depends on the politicians.
My guess is that we'll see the CPI fall along with the index.
$ $ $
Here's a symbol list of 150 chart and candlestick patterns (13 "investment grade" candle patterns) found in today's securities using my version of Patternz: MMM, ALRM, ALL, AXP, AIG, AME, AON, ADM, AWI, AIZ, ATO, ADP, AXS, BCPC, BAH, BRC, BCO, BG, CDNS, CALM, CE, CI, CINF, CTAS, CSCO, CLX, CNA, CNO, CTSH, CL, CSGP, CR, CRH, FANG, DSGR, ^DJI, DOV, DTE, BOOM, EXP, ECL, EME, EMR, EG, XOM, FFIV, FDS, FDP, GL, THG, HLIT, HIG, HL, HD, HWM, HUM, ITW, IBP, IIIN, PODD, TILE, IPI, INTU, KMB, LNC, LMT, L, LPLA, MRCY, NEE, JWN, NWPX, NOVT, NTNX, OMCL, ASGN, OTEX, PKG, PATK, PCG, POR, PRU, DGX, ROP, R, ^GSPC, SEE, SEIC, SIGI, SMTC, SCI, SLGN, STR, SCS, SRDX, TXT, TREX, UHAL, UIS, UNH, UNM, VMI, VRSN, VRTX, VMC, WAT, WWW, IYM, IDU, DDM, FDN, IYZ, IGV, ILF, IGE, IYF, EWA, EWK, ECH, EEM, EWH, EIS, EWI, EWJ, EPP, EWS, EWD, THD, EWU, PEJ, PHO, SSO, XLP, XLF, GLD, XLI, XLB, SPY, UNG, USO, VIS, VAW. Click this link for details (pattern type, start and end dates).
For a list of small patterns (those a few days wide) click this link.
-- Thomas Bulkowski
![]()
$ $ $
I show another slider trading quiz featuring Tuesday Morning: TUES stock.
$ $ $
Here's a symbol list of 335 chart and candlestick patterns (13 "investment grade" candle patterns) found in today's securities using my version of Patternz: MMM, ACIW, ADTN, AEIS, AMD, AKAM, ALRM, ALK, ALL, AMZN, AEP, AXP, AIG, AME, AMGN, APH, APOG, AAPL, AMAT, ATR, ACGL, ADM, ANET, AWI, ARW, AIZ, ADSK, AVA, BMI, BIO, BA, BKNG, BSX, BFH, BMY, BRKR, BBW, CBT, CDNS, CAL, CLS, CX, COR, CNC, CDAY, CIEN, CSCO, CLF, CNO, CNX, CXW, GLW, CSGP, CR, CRH, CSGS, CTS, CMI, CW, DDS, DFS, ^DJI, DOV, DUK, EXP, EBAY, ELV, EME, EMR, EQT, EXC, EXPI, EZPW, FFIV, FDS, FICO, FARO, FIS, FLEX, FLS, FORM, FTNT, FTV, FNV, FCX, GAP, IT, GD, GE, GPN, GS, GGG, GFF, HLIT, HQY, HL, HWM, IEX, ITW, NSP, IIIN, ITGR, INTC, IBKR, IPI, INTU, ISRG, IRM, KALU, KEYS, KMB, KLAC, KLIC, LZB, LH, LRCX, LAMR, LEG, LDOS, LNC, RAMP, LPLA, LXU, MTSI, MANH, MTRN, MDT, META, MU, MSFT, MCO, MS, MOS, MLI, MYGN, ^IXIC, NFG, NFLX, NTGR, NTAP, JWN, NOVT, NTNX, NVDA, OGE, OLN, OTEX, ORCL, OUT, OMI, PKG, PANW, PKE, PATK, PAYX, PCTY, PYPL, PEN, PLXS, PFG, PGR, PEG, PSTG, QTWO, QCOM, RL, RMBS, RJF, RTX, RGS, ROK, ROG, R, ^GSPC, SAIA, CRM, SCHW, SEE, SEIC, SMTC, NOW, SHOP, SLGN, SKYW, SGI, SWX, SPSC, SXI, SSYS, SNPS, TGT, TDOC, TDY, TXT, TTD, TKR, TSCO, TDG, TRV, TZOO, TG, TREX, TWLO, UNH, UNM, VMI, VECO, V, WRB, WSO, WLK, WPM, WSC, WWD, WDAY, ITA, IAI, IYC, DDM, FTEC, FDN, QTEC, FXL, BOTZ, QQQ, IYH, IHF, IAT, IYZ, IEV, IGV, MXI, IXN, SOXX, SLV, IYF, EWA, EWO, EWK, EWC, EWQ, EWG, EIS, EWI, EWJ, EWM, EPP, EZA, EWY, EWP, EWD, EWL, EWT, THD, QLD, PPA, PEJ, SSO, ROBO, XLY, XLF, GLD, XLI, SPY, XAR, XLK, UNG, SMH, VIS, MGK, VONG. Click this link for details (pattern type, start and end dates).
For a list of small patterns (those a few days wide) click this link.
$ $ $
The following table shows where Fibonacci retrace values of the day's high-low range are plus pivot points, calculated on the Dow industrials, sorted by value. When several are near each other (small differences), the area might act as support or resistance.
-- Thomas Bulkowski
![]()
| © 2025 ThePatternSite.com Metric | Value | Diff | Close (within 10% of the high-low range for the day)? |
| Monthly S2 | 32,991.29 | ||
| Monthly S1 | 35,580.85 | 2,589.56 | |
| Daily S2 | 37,226.99 | 1,646.14 | |
| Weekly S2 | 37,463.10 | 236.11 | |
| Daily S1 | 37,698.70 | 235.60 | |
| Weekly S1 | 37,816.75 | 118.05 | |
| Low | 37,830.66 | 13.91 | Yes! The Low is close to the Weekly S1. |
| Close | 38,170.41 | 339.75 | |
| 61.8% Down from Intraday High | 38,241.46 | 71.05 | Yes! The 61.8% Down from Intraday High is close to the Close. |
| Daily Pivot | 38,302.37 | 60.91 | Yes! The Daily Pivot is close to the 61.8% Down from Intraday High. |
| 50% Down from Intraday High | 38,368.35 | 65.98 | Yes! The 50% Down from Intraday High is close to the Daily Pivot. |
| 38.2% Down from Intraday High | 38,495.25 | 126.89 | |
| Daily R1 | 38,774.08 | 278.83 | |
| Open | 38,906.04 | 131.96 | |
| High | 38,906.04 | 0.00 | Yes! The High is close to the Open. |
| Monthly Pivot | 39,201.34 | 295.30 | |
| Weekly Pivot | 39,303.96 | 102.63 | Yes! The Weekly Pivot is close to the Monthly Pivot. |
| Daily R2 | 39,377.75 | 73.79 | Yes! The Daily R2 is close to the Weekly Pivot. |
| Weekly R1 | 39,657.63 | 279.88 | |
| Weekly R2 | 41,144.84 | 1,487.21 | |
| Monthly R1 | 41,790.90 | 646.06 | |
| Monthly R2 | 45,411.39 | 3,620.49 |
$ $ $
I show another slider trading quiz featuring Tuesday Morning: TUES stock.
$ $ $
Here's a symbol list of 335 chart and candlestick patterns (13 "investment grade" candle patterns) found in today's securities using my version of Patternz: MMM, ACIW, ADTN, AEIS, AMD, AKAM, ALRM, ALK, ALL, AMZN, AEP, AXP, AIG, AME, AMGN, APH, APOG, AAPL, AMAT, ATR, ACGL, ADM, ANET, AWI, ARW, AIZ, ADSK, AVA, BMI, BIO, BA, BKNG, BSX, BFH, BMY, BRKR, BBW, CBT, CDNS, CAL, CLS, CX, COR, CNC, CDAY, CIEN, CSCO, CLF, CNO, CNX, CXW, GLW, CSGP, CR, CRH, CSGS, CTS, CMI, CW, DDS, DFS, ^DJI, DOV, DUK, EXP, EBAY, ELV, EME, EMR, EQT, EXC, EXPI, EZPW, FFIV, FDS, FICO, FARO, FIS, FLEX, FLS, FORM, FTNT, FTV, FNV, FCX, GAP, IT, GD, GE, GPN, GS, GGG, GFF, HLIT, HQY, HL, HWM, IEX, ITW, NSP, IIIN, ITGR, INTC, IBKR, IPI, INTU, ISRG, IRM, KALU, KEYS, KMB, KLAC, KLIC, LZB, LH, LRCX, LAMR, LEG, LDOS, LNC, RAMP, LPLA, LXU, MTSI, MANH, MTRN, MDT, META, MU, MSFT, MCO, MS, MOS, MLI, MYGN, ^IXIC, NFG, NFLX, NTGR, NTAP, JWN, NOVT, NTNX, NVDA, OGE, OLN, OTEX, ORCL, OUT, OMI, PKG, PANW, PKE, PATK, PAYX, PCTY, PYPL, PEN, PLXS, PFG, PGR, PEG, PSTG, QTWO, QCOM, RL, RMBS, RJF, RTX, RGS, ROK, ROG, R, ^GSPC, SAIA, CRM, SCHW, SEE, SEIC, SMTC, NOW, SHOP, SLGN, SKYW, SGI, SWX, SPSC, SXI, SSYS, SNPS, TGT, TDOC, TDY, TXT, TTD, TKR, TSCO, TDG, TRV, TZOO, TG, TREX, TWLO, UNH, UNM, VMI, VECO, V, WRB, WSO, WLK, WPM, WSC, WWD, WDAY, ITA, IAI, IYC, DDM, FTEC, FDN, QTEC, FXL, BOTZ, QQQ, IYH, IHF, IAT, IYZ, IEV, IGV, MXI, IXN, SOXX, SLV, IYF, EWA, EWO, EWK, EWC, EWQ, EWG, EIS, EWI, EWJ, EWM, EPP, EZA, EWY, EWP, EWD, EWL, EWT, THD, QLD, PPA, PEJ, SSO, ROBO, XLY, XLF, GLD, XLI, SPY, XAR, XLK, UNG, SMH, VIS, MGK, VONG. Click this link for details (pattern type, start and end dates).
For a list of small patterns (those a few days wide) click this link.
$ $ $
The following table shows where Fibonacci retrace values of the day's high-low range are plus pivot points, calculated on the Dow industrials, sorted by value. When several are near each other (small differences), the area might act as support or resistance.
-- Thomas Bulkowski
![]()
| © 2025 ThePatternSite.com Metric | Value | Diff | Close (within 10% of the high-low range for the day)? |
| Monthly S2 | 32,991.29 | ||
| Monthly S1 | 35,580.85 | 2,589.56 | |
| Daily S2 | 37,226.99 | 1,646.14 | |
| Weekly S2 | 37,463.10 | 236.11 | |
| Daily S1 | 37,698.70 | 235.60 | |
| Weekly S1 | 37,816.75 | 118.05 | |
| Low | 37,830.66 | 13.91 | Yes! The Low is close to the Weekly S1. |
| Close | 38,170.41 | 339.75 | |
| 61.8% Down from Intraday High | 38,241.46 | 71.05 | Yes! The 61.8% Down from Intraday High is close to the Close. |
| Daily Pivot | 38,302.37 | 60.91 | Yes! The Daily Pivot is close to the 61.8% Down from Intraday High. |
| 50% Down from Intraday High | 38,368.35 | 65.98 | Yes! The 50% Down from Intraday High is close to the Daily Pivot. |
| 38.2% Down from Intraday High | 38,495.25 | 126.89 | |
| Daily R1 | 38,774.08 | 278.83 | |
| Open | 38,906.04 | 131.96 | |
| High | 38,906.04 | 0.00 | Yes! The High is close to the Open. |
| Monthly Pivot | 39,201.34 | 295.30 | |
| Weekly Pivot | 39,303.96 | 102.63 | Yes! The Weekly Pivot is close to the Monthly Pivot. |
| Daily R2 | 39,377.75 | 73.79 | Yes! The Daily R2 is close to the Weekly Pivot. |
| Weekly R1 | 39,657.63 | 279.88 | |
| Weekly R2 | 41,144.84 | 1,487.21 | |
| Monthly R1 | 41,790.90 | 646.06 | |
| Monthly R2 | 45,411.39 | 3,620.49 |
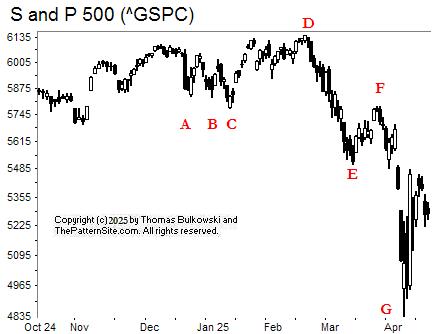
Two patterns I want to highlight today. The first is ABC. It's a triple bottom, but not a good example. Valley C is below the other two when all three should be about equal. I blame politics.
![]()
It confirms as a valid chart pattern when the index closes above the highest peak between the three bottoms. That happens but the index doesn't rise far, to D.
The second pattern is DEFG. It's called a measured move down. The thinking behind the pattern is that leg FG will mirror the extent and time of leg DE. In this case, the second leg (FG) is longer than DE and it took only a few days to bottom.
The beauty of this pattern is not the DEFG move, but what happens next. In many cases, the index (stock really) will return to the corrective phase, which is EF. Fully 77% of the patterns I looked at see price rise to that level (EF).
In this example, the large white bar almost touches the price of E.
![]()
The following is a brief review of how the markets performed over time. The numbers refer to the close-to-close move in the Dow industrials.
No options expire this week.
![]()
The following is based on an SFO article in December 2004 by John Seekinger, titled, "Take a two-dimensional approach." He offers these tips.
| Index | S2 | S1 | Pivot | R1 | R2 |
| Dow Industrials (^DJI): Daily | 38,484 | 38,813 | 39,279 | 39,608 | 40,075 |
| Weekly | 37,787 | 38,465 | 39,628 | 40,306 | 41,469 |
| Monthly | 33,315 | 36,229 | 39,525 | 42,439 | 45,735 |
| S&P500 (^GSPC): Daily | 5,216 | 5,249 | 5,289 | 5,322 | 5,362 |
| Weekly | 5,082 | 5,183 | 5,321 | 5,421 | 5,560 |
| Monthly | 4,350 | 4,816 | 5,302 | 5,768 | 6,253 |
| Nasdaq (^IXIC): Daily | 16,065 | 16,176 | 16,292 | 16,403 | 16,519 |
| Weekly | 15,426 | 15,856 | 16,496 | 16,927 | 17,567 |
| Monthly | 12,953 | 14,620 | 16,451 | 18,117 | 19,948 |
Here are the formulas:
![]()
Earnings season is either underway or should be starting soon. The sessions could be more volatile.
Here's a symbol list of 199 chart and candlestick patterns (13 "investment grade" candle patterns) found in today's securities using my version of Patternz: ADTN, AEIS, ALK, AMZN, AXP, AIG, AME, APH, APOG, AMAT, ACGL, ADM, ANET, AWI, ARW, ADSK, BMI, BIO, BA, BKNG, BSX, BFH, BRKR, BBW, CDNS, CLS, CX, CNC, CDAY, CIEN, CLF, CNO, CNX, CXW, GLW, CSGP, CR, CRH, CSGS, CTS, CW, DDS, DFS, DOV, DUK, ELV, EME, EMR, EQT, FFIV, FICO, FARO, FLEX, FLS, FORM, FTNT, FNV, FCX, GAP, IT, GD, GE, GS, GOOGL, GFF, HLIT, HQY, HL, HWM, IIIN, PODD, ITGR, IBKR, IPI, INTU, ISRG, IRM, KALU, KEYS, KLAC, KLIC, LZB, LRCX, LAMR, RAMP, LPLA, MTSI, MANH, MTRN, MU, MCO, MS, MOS, MLI, ^IXIC, NFG, NFLX, NTGR, NTAP, JWN, NOVT, NTNX, NVDA, OLN, OTEX, OUT, PKG, PANW, PKE, PATK, PCTY, PYPL, PEN, PLXS, PGR, PEG, PSTG, QTWO, QCOM, RL, RMBS, RJF, RTX, ROK, R, SAIA, SCHW, SEE, SEIC, NOW, SHOP, SKYW, SGI, SWX, SPSC, SSYS, SNPS, TDY, TXT, TTD, TDG, TZOO, TG, TREX, TWLO, UNM, VMI, VECO, V, WSO, WLK, WPM, WWD, WDAY, ITA, IAI, DDM, FTEC, FDN, QTEC, FXL, BOTZ, QQQ, IAT, IEV, IGV, MXI, IXN, SOXX, SLV, IYF, EWA, EWO, EWK, EWC, EWG, EIS, EWJ, EZA, EWY, EWP, EWD, EWL, THD, QLD, PPA, PEJ, SSO, ROBO, XLF, XLI, SPY, XAR, XLK, SMH, VIS, MGK, VONG. Click this link for details (pattern type, start and end dates).
For a list of small patterns (those a few days wide) click this link.
The below industries were the best (rank 1) or worst performing of those I follow.
|
-- Thomas Bulkowski
![]()
$ $ $

I show a picture of the Nasdaq composite on the 5-minute scale.
There's not a lot going on except for unusually tall swings (daily chart really). I'm sure you've noticed.
AB might look like a double top. It has twin peaks (AB) near the same price but it's not a double top. Why?
Answer: because it's unconfirmed. What's that mean? Price has to close below line C, which is a horizontal line I drew connecting the lowest valley between the two peaks.
Compare ABC to DEF. DE are two peaks near the same price. The horizontal line ending above F is the confirmation price. At F, the index closes below the line and confirms the pattern as a true double top. In this case, however, the decline stops at F and rebounds to A. Yes, not all patterns work as we hope or expect.
It's possible that the index will close below C and confirm the double top in the coming day(s). I think that's likely but it's just a guess. Who can tell how politics will throw around price tomorrow?
$ $ $
Here's a symbol list of 321 chart and candlestick patterns (13 "investment grade" candle patterns) found in today's securities using my version of Patternz: DDD, MMM, ANF, ACIW, AYI, ADTN, AEIS, AMD, AES, ALK, ALGT, AMZN, AXP, AIG, AMWD, AME, APH, AON, APOG, AMAT, ACGL, ADM, ANET, AWI, ARW, ASH, ADSK, ADP, BMI, BCPC, BECN, BIO, BKH, BA, BKNG, BOOT, BSX, BFH, BRKR, BBW, CBT, CDNS, CPB, CLS, CX, CNC, CDAY, CF, CIEN, CSCO, CLF, CNO, CNX, CXW, GLW, CSGP, COTY, CR, CRH, CSGS, CTS, CMI, CW, DDS, DFS, DSGR, ^DJT, ^DJI, DOV, DUK, EMN, ELV, EME, EMR, EPAM, EQT, EXC, EXPI, EZPW, FFIV, FICO, FARO, FLEX, FLS, FORM, FTNT, FNV, FCX, GAP, IT, GD, GE, GIS, GFS, GMS, GS, GOOGL, GGG, GFF, GES, HLIT, HQY, HL, HWM, HUBG, JBHT, HUN, IEX, ILMN, IBP, IIIN, PODD, ITGR, INTC, IBKR, TILE, IPI, INTU, ISRG, IRM, KALU, KBH, KEYS, KLAC, KLIC, LHX, LZB, LRCX, LAMR, LANC, RAMP, LPLA, MTSI, MANH, MTRN, MTRX, META, MGEE, MU, MSFT, MCO, MS, MOS, MLI, ^IXIC, NFG, NFLX, NTGR, NTAP, NEU, NKE, NI, JWN, NWPX, NOVT, NTNX, NVDA, ORI, OLN, ON, OTEX, ORCL, OUT, PKG, PANW, PKE, PATK, PCTY, PYPL, PEN, PFE, PCG, PNW, PLXS, PGR, PRU, PEG, PSTG, QTWO, QCOM, RL, RMBS, RJF, RTX, ROK, ROG, R, ^GSPC, SAIA, CRM, SCHW, SEE, SEIC, SMTC, SCI, NOW, SHOP, STR, SKYW, SGI, SO, LUV, SWX, SPSC, SXI, SSYS, SNPS, TPR, TDOC, TDY, TDC, TER, TXN, TXT, TTD, TDG, TZOO, TG, TREX, TWLO, UNM, VMI, VECO, VRTX, V, WSO, WERN, WLK, WPM, WSM, WSC, WWD, WDAY, ITA, IYM, IAI, IYC, DDM, FTEC, FDN, QTEC, FXL, BOTZ, QQQ, ICF, IAT, IEV, IGV, MXI, IXN, SOXX, SLV, IYF, EWA, EWO, EWK, EWC, EWQ, EWG, EIS, EWJ, EWS, EZA, EWY, EWP, EWD, EWL, THD, TUR, EWU, QLD, PPA, DBA, PEJ, SSO, ROBO, XLY, XLF, GLD, XLV, XLI, XRT, SPY, XAR, XLK, SMH, VHT, VIS, MGK, VONG. Click this link for details (pattern type, start and end dates).
For a list of small patterns (those a few days wide) click this link.
$ $ $
The following table shows where Fibonacci retrace values of the day's high-low range are plus pivot points, calculated on the Nasdaq composite, sorted by value. When several are near each other (small differences), the area might act as support or resistance.
-- Thomas Bulkowski
![]()
| © 2025 ThePatternSite.com Metric | Value | Diff | Close (within 10% of the high-low range for the day)? |
| Monthly S2 | 12,960.34 | ||
| Weekly S2 | 13,679.13 | 718.79 | |
| Monthly S1 | 14,633.75 | 954.62 | |
| Weekly S1 | 14,993.15 | 359.40 | |
| Daily S2 | 15,790.76 | 797.61 | |
| Daily S1 | 16,048.96 | 258.20 | |
| Low | 16,066.46 | 17.50 | Yes! The Low is close to the Daily S1. |
| Weekly Pivot | 16,098.04 | 31.58 | Yes! The Weekly Pivot is close to the Low. |
| 61.8% Down from Intraday High | 16,270.41 | 172.37 | |
| Close | 16,307.16 | 36.75 | Yes! The Close is close to the 61.8% Down from Intraday High. |
| Daily Pivot | 16,324.66 | 17.50 | Yes! The Daily Pivot is close to the Close. |
| 50% Down from Intraday High | 16,333.41 | 8.75 | Yes! The 50% Down from Intraday High is close to the Daily Pivot. |
| 38.2% Down from Intraday High | 16,396.41 | 63.00 | |
| Monthly Pivot | 16,457.44 | 61.03 | |
| Open | 16,499.69 | 42.25 | Yes! The Open is close to the Monthly Pivot. |
| Daily R1 | 16,582.86 | 83.17 | |
| High | 16,600.36 | 17.50 | Yes! The High is close to the Daily R1. |
| Daily R2 | 16,858.56 | 258.20 | |
| Weekly R1 | 17,412.06 | 553.50 | |
| Monthly R1 | 18,130.85 | 718.79 | |
| Weekly R2 | 18,516.95 | 386.10 | |
| Monthly R2 | 19,954.54 | 1,437.59 |

This is a picture of the chart pattern indicator on the daily scale. The indicator is the line chart below a chart of the S&P 500 composite.
The most recent signal is bullish, as the short green bar on the far right of the chart attests. That signal change happened because of the large move up in the index.
The inset on the far left of the chart, shows the same scenario, only from the view of the indicator.
The last few days, the CPI has weakened. My guess is that yes, we'll see market weakness. When you see a CPI peak, the indicator makes a substantial move down. However, there is not always a big move down in the index. Fortunately, you are given a warning of the downturn. So that helps.
$ $ $
Here's a symbol list of 308 chart and candlestick patterns (13 "investment grade" candle patterns) found in today's securities using my version of Patternz: DDD, MMM, ANF, ACIW, AYI, ADTN, AEIS, AMD, ALK, AMZN, AEO, AXP, AIG, AMWD, AME, APH, AON, APOG, AMAT, ARCB, ACGL, ADM, ANET, AWI, ARW, ADSK, ADP, BMI, BECN, BIO, BKH, BA, BKNG, BOOT, BSX, BFH, BRKR, BBW, CBT, CDNS, CAL, CPB, CLS, CX, CNC, CDAY, CIEN, CSCO, CLF, CNO, CNX, CXW, GLW, CSGP, COTY, CR, CRH, CSGS, CTS, CMI, CW, DECK, DDS, DFS, DSGR, ^DJT, ^DJI, DOV, DUK, EMN, ELV, EME, EMR, EPAM, EFX, EQT, EG, EVH, EXPI, EZPW, FFIV, FICO, FARO, FLEX, FLS, FORM, FTNT, FNV, FCX, GAP, IT, GD, GE, GIS, GFS, GMS, GS, GOOGL, GGG, GFF, GES, HLIT, HIG, HQY, HL, HSII, HON, HWM, JBHT, HUN, IEX, ILMN, IBP, IIIN, PODD, ITGR, IPAR, IBKR, TILE, IPI, INTU, ISRG, IRM, KALU, KEYS, KLAC, KSS, KLIC, LHX, LZB, LRCX, LAMR, LANC, RAMP, LPLA, MTSI, MANH, MTRN, MDT, META, MU, MSFT, MCO, MS, MOS, MLI, ^IXIC, NFG, NFLX, NTGR, NTAP, NKE, JWN, NWPX, NOVT, NTNX, NVDA, OLN, ON, OTEX, ORCL, OUT, OMI, PKG, PANW, PKE, PATK, PCTY, PYPL, PEN, PCG, PNW, PLXS, PG, PGR, PRU, PEG, PSTG, QTWO, QCOM, RL, RMBS, RJF, RTX, RHI, ROK, R, ^GSPC, SAIA, CRM, SBH, SCHW, SEE, SEIC, SCI, NOW, SHOP, SKYW, SGI, SWX, SPSC, SXI, SSYS, SNPS, TPR, TECH, TDOC, TDY, TDC, TER, TXT, TTD, TDG, TZOO, TG, TREX, TWLO, UNM, VMI, VECO, MDRX, V, WRB, WSO, WERN, WLK, WPM, WSM, WSC, WWD, WDAY, ITA, IYM, IAI, IYC, DDM, FTEC, FDN, QTEC, FXL, BOTZ, QQQ, IYH, IAT, IEV, IGV, MXI, IXN, SOXX, SLV, IYF, IHI, EWA, EWO, EWK, EWC, EWG, EIS, EWI, EWJ, EWS, EZA, EWY, EWP, EWD, EWL, THD, EWU, QLD, PPA, PEJ, SSO, ROBO, XLY, XLF, XLV, XLI, XRT, SPY, XAR, XLK, SMH, VHT, VIS, MGK, VONG. Click this link for details (pattern type, start and end dates).
For a list of small patterns (those a few days wide) click this link.
-- Thomas Bulkowski
![]()
$ $ $
I show another slider trading quiz featuring TXU stock.
$ $ $
Here's a symbol list of 91 chart and candlestick patterns (13 "investment grade" candle patterns) found in today's securities using my version of Patternz: DDD, ABT, ANF, ACIW, ADBE, ALGT, ALL, AFG, AME, AWI, ASH, AVY, AVNT, BCPC, BALL, BKH, BBW, CF, CLNE, CAG, DECK, ^DJI, DOV, BOOM, ECL, ELV, EQT, EL, EVH, FDS, FISV, FMC, HE, HON, DHI, HUM, ITW, INTU, KMT, L, M, MA, META, OMC, ASGN, OTEX, OR, OXM, PKG, PAYX, PCG, PG, QTWO, RGA, RLI, ^GSPC, SEIC, SIGI, SHW, SLGN, LUV, TXT, TOL, UHAL, UIS, UNM, VECO, V, WRB, WSM, WSC, IAI, IDU, DDM, FXI, ICF, ILF, IYF, ITB, EWZ, EEM, EWH, EZA, EWD, EWU, PHO, SSO, XLF, XLI, UNG, VIS. Click this link for details (pattern type, start and end dates).
For a list of small patterns (those a few days wide) click this link.
$ $ $
The following table shows where Fibonacci retrace values of the day's high-low range are plus pivot points, calculated on the Dow industrials, sorted by value. When several are near each other (small differences), the area might act as support or resistance.
-- Thomas Bulkowski
![]()
| © 2025 ThePatternSite.com Metric | Value | Diff | Close (within 10% of the high-low range for the day)? |
| Monthly S2 | 33,724.85 | ||
| Weekly S2 | 35,138.17 | 1,413.32 | |
| Monthly S1 | 37,124.82 | 1,986.65 | |
| Weekly S1 | 37,831.48 | 706.66 | |
| Weekly Pivot | 39,305.09 | 1,473.61 | |
| Daily S2 | 39,868.10 | 563.01 | |
| Monthly Pivot | 40,011.75 | 143.65 | |
| Low | 40,159.02 | 147.27 | |
| Daily S1 | 40,196.45 | 37.43 | Yes! The Daily S1 is close to the Low. |
| 61.8% Down from Intraday High | 40,395.58 | 199.14 | |
| 50% Down from Intraday High | 40,468.66 | 73.07 | |
| Daily Pivot | 40,487.37 | 18.71 | Yes! The Daily Pivot is close to the 50% Down from Intraday High. |
| Close | 40,524.79 | 37.42 | Yes! The Close is close to the Daily Pivot. |
| 38.2% Down from Intraday High | 40,541.73 | 16.94 | Yes! The 38.2% Down from Intraday High is close to the Close. |
| Open | 40,546.15 | 4.42 | Yes! The Open is close to the 38.2% Down from Intraday High. |
| High | 40,778.29 | 232.14 | |
| Daily R1 | 40,815.71 | 37.43 | Yes! The Daily R1 is close to the High. |
| Daily R2 | 41,106.64 | 290.92 | |
| Weekly R1 | 41,998.40 | 891.76 | |
| Monthly R1 | 43,411.72 | 1,413.32 | |
| Weekly R2 | 43,472.01 | 60.29 | Yes! The Weekly R2 is close to the Monthly R1. |
| Monthly R2 | 46,298.65 | 2,826.64 |

I show a picture of the Nasdaq on the daily scale.
At B, the top of the chart, we see a triple top chart pattern. At C, when the index closes below the green line, the triple top confirms as a valid chart pattern.
What's that mean?
It means the index is going down (but not how far or for how long).
As you can see, the drop to D was breathtaking.
D was the low and I expect to see a second bottom form, E. Note that I expect E to bottom above D. It might or might not follow arc A (I don't expect it to). Timing? My guess is this will take 3 months, about the time the tariffs come into focus again.
All of this is a guess, of course.
![]()
The following is a brief review of how the markets performed over time. The numbers refer to the close-to-close move in the Dow industrials.
Many options expire this week, so traders will be looking to close out their positions, and that suggests increased volatility (large daily price swings).
![]()
The following is based on an SFO article in December 2004 by John Seekinger, titled, "Take a two-dimensional approach." He offers these tips.
| Index | S2 | S1 | Pivot | R1 | R2 |
| Dow Industrials (^DJI): Daily | 38,808 | 39,511 | 39,957 | 40,660 | 41,106 |
| Weekly | 35,034 | 37,623 | 39,201 | 41,790 | 43,368 |
| Monthly | 33,621 | 36,917 | 39,908 | 43,204 | 46,195 |
| S&P500 (^GSPC): Daily | 5,161 | 5,262 | 5,322 | 5,423 | 5,483 |
| Weekly | 4,580 | 4,972 | 5,227 | 5,618 | 5,873 |
| Monthly | 4,377 | 4,870 | 5,328 | 5,822 | 6,280 |
| Nasdaq (^IXIC): Daily | 16,043 | 16,384 | 16,569 | 16,909 | 17,094 |
| Weekly | 13,818 | 15,271 | 16,237 | 17,690 | 18,656 |
| Monthly | 13,099 | 14,912 | 16,597 | 18,409 | 20,094 |
Here are the formulas:
![]()
Earnings season will be starting in about 2 days.
Here's a symbol list of 60 chart and candlestick patterns (13 "investment grade" candle patterns) found in today's securities using my version of Patternz: ABT, AFL, AFG, ACGL, ADSK, ADP, BZH, BCO, CDNS, CNC, CSGP, CCK, DDS, EXP, FFIV, FTNT, FNV, GFF, HIG, HL, HWM, IRM, KLAC, L, LPLA, LXU, MSFT, MS, MLI, ^IXIC, OTEX, OR, OMI, PAYX, PCG, RJF, RLI, RGLD, SAND, SCHW, SIGI, SHW, SRDX, TDG, VRSN, VMC, WRB, WPM, FTEC, QQQ, IXN, SLV, THD, QLD, GLD, SPY, XLK, MGK, VONG. Click this link for details (pattern type, start and end dates).
For a list of small patterns (those a few days wide) click this link.
The below industries were the best (rank 1) or worst performing of those I follow.
|
-- Thomas Bulkowski
![]()
Here's a symbol list of 36 chart and candlestick patterns (13 "investment grade" candle patterns) found in today's securities using my version of Patternz: ABT, AEP, AFG, ADM, ATO, BKH, CRL, CXW, EZPW, FICO, GD, IIIN, LMT, L, MRCY, JWN, NOC, OR, OMI, PAYX, PPL, PG, PGR, RLI, ROL, SAND, SAIC, SIGI, SRDX, VRSN, WRB, IYK, XLP, GLD. Click this link for details (pattern type, start and end dates).
For a list of small patterns (those a few days wide) click this link.
$ $ $
You can find setups based on a Fibonacci retrace by clicking on the link.
The following patterns were found manually, not using Patternz. Mr. Bulkowski has excluded any securities he owns from appearing in the list. However, he may add any of the securities listed to his portfolio at any time, just as you can.
In the table below, the red and green colors are based on the historical breakout direction for the associated chart pattern. If a high and tight flag appears, the start and end dates highlight the flagpole only and not the flag.
For details about the chart patterns, click here.
-- Thomas Bulkowski, author: Invest for Two-Comma Wealth and the novel (fiction), Foresight (#Ad)
![]()
| Symbol | Chart Pattern | Bullish Bearish | Start | End | Industry |
| ABM | Double Top, Eve and Adam | 02/26/2025 | 03/07/2025 | Industrial Services | |
| AMD | Double Top, Eve and Eve | 02/20/2025 | 03/26/2025 | Semiconductor | |
| AKAM | Pipe top | 03/03/2025 | 03/10/2025 | E-Commerce | |
| ALL | Head-and-shoulders top | 03/17/2025 | 03/26/2025 | Insurance (Prop/Casualty) | |
| AMGN | Double Top, Adam and Adam | 03/31/2025 | 04/03/2025 | Biotechnology | |
| APH | Head-and-shoulders top | 03/19/2025 | 04/02/2025 | Electronics | |
| AR | Double Top, Adam and Adam | 03/26/2025 | 04/02/2025 | Natural Gas (Diversified) | |
| ADM | Head-and-shoulders top | 02/24/2025 | 03/17/2025 | Food Processing | |
| ARW | Double Top, Adam and Adam | 03/10/2025 | 03/19/2025 | Electronics | |
| BIIB | Pipe top | 03/03/2025 | 03/10/2025 | Biotechnology | |
| BKH | Triple top | 03/04/2025 | 04/03/2025 | Electric Utility (West) | |
| BR | Double Top, Eve and Adam | 03/03/2025 | 04/02/2025 | Information Services | |
| BG | Double Top, Adam and Eve | 03/10/2025 | 04/03/2025 | Food Processing | |
| CACI | Ugly double bottom | 02/21/2025 | 03/21/2025 | IT Services | |
| CLS | Pipe top | 03/17/2025 | 03/24/2025 | Electronics | |
| CX | Double Top, Eve and Adam | 03/06/2025 | 03/25/2025 | Cement and Aggregates | |
| CF | Double Top, Adam and Adam | 03/03/2025 | 04/03/2025 | Chemical (Basic) | |
| CRL | Dead-cat bounce | 04/10/2025 | 04/10/2025 | Biotechnology | |
| CINF | Triple top | 03/03/2025 | 03/28/2025 | Insurance (Prop/Casualty) | |
| CNA | Triple top | 12/05/2024 | 03/28/2025 | Insurance (Prop/Casualty) | |
| GLW | Pipe top | 03/17/2025 | 03/24/2025 | Telecom. Equipment | |
| CCK | Ugly double bottom | 01/10/2025 | 02/05/2025 | Packaging and Container | |
| DVN | Triple top | 01/15/2025 | 04/02/2025 | Natural Gas (Diversified) | |
| D | Double Top, Adam and Adam | 03/10/2025 | 04/03/2025 | Electric Utility (East) | |
| EIX | Double Top, Eve and Adam | 03/17/2025 | 04/03/2025 | Electric Utility (West) | |
| EQT | Double Top, Adam and Adam | 03/26/2025 | 04/02/2025 | Natural Gas (Diversified) | |
| EXPD | Pipe top | 03/03/2025 | 03/10/2025 | Air Transport | |
| FARO | Pipe top | 02/24/2025 | 03/03/2025 | Precision Instrument | |
| FLEX | Pipe top | 03/17/2025 | 03/24/2025 | Electronics | |
| FORM | Double Top, Eve and Eve | 03/10/2025 | 03/19/2025 | Semiconductor | |
| GAP | Triangle, symmetrical | 02/18/2025 | 04/02/2025 | Apparel | |
| GD | Double Top, Adam and Adam | 03/10/2025 | 04/03/2025 | Aerospace/Defense | |
| GIS | Pipe top | 03/03/2025 | 03/10/2025 | Food Processing | |
| GGG | Double Top, Eve and Adam | 02/21/2025 | 03/10/2025 | Machinery | |
| GFF | Double Top, Eve and Adam | 03/25/2025 | 04/02/2025 | Building Materials | |
| HLIT | Double Top, Eve and Eve | 02/19/2025 | 03/05/2025 | Telecom. Equipment | |
| HON | Three Falling Peaks | 03/10/2025 | 04/02/2025 | Aerospace/Defense | |
| HWM | Triple top | 02/19/2025 | 03/26/2025 | Aerospace/Defense | |
| HUM | Triple bottom | 02/11/2025 | 04/07/2025 | Medical Services | |
| HURC | Double Top, Eve and Adam | 11/29/2024 | 02/13/2025 | Machinery | |
| INCY | Double Top, Eve and Eve | 03/24/2025 | 04/04/2025 | Drug | |
| IBP | Triple top | 03/10/2025 | 04/07/2025 | Retail Building Supply | |
| INTC | Double Top, Adam and Adam | 02/18/2025 | 03/18/2025 | Semiconductor | |
| ISRG | Double Top, Adam and Adam | 03/12/2025 | 03/26/2025 | Medical Supplies | |
| JKHY | Pipe top | 03/03/2025 | 03/10/2025 | IT Services | |
| LHX | Triple top | 03/19/2025 | 04/03/2025 | Aerospace/Defense | |
| LMT | Double Bottom, Adam and Adam | 03/24/2025 | 04/07/2025 | Aerospace/Defense | |
| MUR | Double Top, Eve and Eve | 02/11/2025 | 04/02/2025 | Petroleum (Integrated) | |
| NBR | Dead-cat bounce | 04/04/2025 | 04/04/2025 | Oilfield Svcs/Equipment | |
| NJR | Double Top, Adam and Adam | 03/31/2025 | 04/03/2025 | Natural Gas (Distributor) | |
| NTNX | Pipe top | 02/24/2025 | 03/03/2025 | E-Commerce | |
| OGE | Double Top, Eve and Adam | 03/03/2025 | 04/03/2025 | Electric Utility (Central) | |
| OLN | Triangle, symmetrical | 03/03/2025 | 03/31/2025 | Chemical (Basic) | |
| OMI | Horn top | 03/03/2025 | 03/17/2025 | Medical Supplies | |
| OXM | Double Top, Adam and Adam | 03/10/2025 | 03/27/2025 | Apparel | |
| PKG | Double Top, Adam and Adam | 03/25/2025 | 04/02/2025 | Packaging and Container | |
| PTEN | Dead-cat bounce | 04/03/2025 | 04/03/2025 | Oilfield Svcs/Equipment | |
| PETS | Rectangle bottom | 03/04/2025 | 04/01/2025 | Medical Services | |
| PGR | Head-and-shoulders top | 03/04/2025 | 04/03/2025 | Insurance (Prop/Casualty) | |
| PRU | Double Top, Adam and Adam | 03/03/2025 | 03/26/2025 | Insurance (Life) | |
| PEG | Double Top, Eve and Eve | 03/24/2025 | 04/02/2025 | Electric Utility (East) | |
| QCOM | Double Top, Adam and Eve | 03/07/2025 | 03/25/2025 | Telecom. Equipment | |
| DGX | Double Top, Adam and Adam | 03/18/2025 | 04/03/2025 | Medical Services | |
| RTX | Triple top | 03/03/2025 | 03/26/2025 | Aerospace/Defense | |
| RGA | Double Top, Adam and Adam | 03/03/2025 | 03/26/2025 | Insurance (Life) | |
| SLB | Double Top, Eve and Adam | 02/18/2025 | 03/26/2025 | Oilfield Svcs/Equipment | |
| SO | Double Top, Adam and Adam | 03/10/2025 | 04/04/2025 | Electric Utility (East) | |
| SCCO | Pipe top | 03/17/2025 | 03/24/2025 | Metals and Mining (Div.) | |
| RIG | Dead-cat bounce | 04/03/2025 | 04/03/2025 | Oilfield Svcs/Equipment | |
| TRV | Double Top, Adam and Eve | 03/18/2025 | 03/28/2025 | Insurance (Prop/Casualty) | |
| UGI | Double Top, Eve and Adam | 03/03/2025 | 04/01/2025 | Natural Gas (Distributor) | |
| UNM | Double Top, Eve and Eve | 02/27/2025 | 03/25/2025 | Insurance (Diversified) | |
| VLO | Double Top, Eve and Eve | 11/19/2024 | 02/04/2025 | Petroleum (Integrated) | |
| WAT | Head-and-shoulders top | 12/11/2024 | 03/10/2025 | Precision Instrument | |
| WSO | Double Top, Adam and Adam | 02/18/2025 | 03/10/2025 | Retail Building Supply | |
| WU | Pipe top | 03/03/2025 | 03/10/2025 | Financial Services | |
| WMB | Double Top, Eve and Adam | 03/25/2025 | 04/02/2025 | Natural Gas (Distributor) | |
| WWW | Double Top, Eve and Adam | 03/25/2025 | 04/02/2025 | Shoe | |
| XEL | Double Top, Eve and Adam | 03/04/2025 | 04/04/2025 | Electric Utility (West) |
![]()
$ $ $

I show a picture of the Nasdaq composite on the 5-minute scale.
Valleys A and B form a pattern called a double bottom. It breaks out upward at C when price closes above the red line. It suggests that there's still room to climb (meaning price hasn't reached the target yet, which is slightly less than 18,000, eyeballing it, based on the pattern's height).
The AD move was tasty at about 1,500 points.
$ $ $
Special note: The CPI reading is bogus because with such large swings in the market, the CPI is having trouble finding patterns. I'm looking into it. Patternz says it's 0.
$ $ $
Here's a symbol list of 130 chart and candlestick patterns (13 "investment grade" candle patterns) found in today's securities using my version of Patternz: DDD, ABT, ADTN, AEIS, AES, ALL, AEE, AFG, AIG, APH, ACGL, ANET, AVA, AXS, BZH, BKH, BKNG, BOOT, BRC, BFH, BRKR, BBW, CBT, CACI, CPB, CIEN, CTAS, CLNE, CNA, CL, CMTL, CAG, COTY, CR, CSGS, CTS, CW, DECK, DFS, DUK, EXP, EME, EOG, EQT, EVH, FFIV, FARO, FIS, FLEX, FNV, GME, GD, GES, HTLD, HL, HNI, HWM, IDA, NSP, IBP, PODD, ITGR, TILE, KALU, KEYS, LANC, RAMP, L, MHO, MANH, MRTN, MTRN, META, MS, NFLX, NOC, OMCL, OMC, OTEX, ORCL, OR, OMI, PAYX, PEN, PNW, PINC, KWR, RJF, RLI, ROST, RGLD, CRM, SAND, SIGI, SHOP, SKYW, SO, SPSC, SCS, SRDX, TPR, TJX, UNM, VRSN, WRB, WERN, WU, WPM, XEL, IYM, FXI, IAT, ILF, SLV, THD, TUR, PXJ, PHO, XLI, VIS. Click this link for details (pattern type, start and end dates).
For a list of small patterns (those a few days wide) click this link.
$ $ $
The following table shows where Fibonacci retrace values of the day's high-low range are plus pivot points, calculated on the Nasdaq composite, sorted by value. When several are near each other (small differences), the area might act as support or resistance.
-- Thomas Bulkowski
![]()
| © 2025 ThePatternSite.com Metric | Value | Diff | Close (within 10% of the high-low range for the day)? |
| Monthly S2 | 13,814.36 | ||
| Daily S2 | 14,600.07 | 785.71 | |
| Weekly S2 | 14,664.88 | 64.81 | Yes! The Weekly S2 is close to the Daily S2. |
| Low | 15,270.28 | 605.40 | |
| Open | 15,295.44 | 25.16 | Yes! The Open is close to the Low. |
| Monthly S1 | 15,469.67 | 174.23 | Yes! The Monthly S1 is close to the Open. |
| Daily S1 | 15,862.52 | 392.85 | |
| Weekly S1 | 15,894.93 | 32.41 | Yes! The Weekly S1 is close to the Daily S1. |
| 61.8% Down from Intraday High | 16,008.56 | 113.63 | Yes! The 61.8% Down from Intraday High is close to the Weekly S1. |
| 50% Down from Intraday High | 16,236.61 | 228.05 | |
| 38.2% Down from Intraday High | 16,464.66 | 228.05 | |
| Daily Pivot | 16,532.73 | 68.07 | Yes! The Daily Pivot is close to the 38.2% Down from Intraday High. |
| Weekly Pivot | 16,805.72 | 272.99 | |
| Close | 17,124.97 | 319.25 | |
| High | 17,202.94 | 77.97 | Yes! The High is close to the Close. |
| Monthly Pivot | 17,230.98 | 28.04 | Yes! The Monthly Pivot is close to the High. |
| Daily R1 | 17,795.18 | 564.20 | |
| Weekly R1 | 18,035.77 | 240.59 | |
| Daily R2 | 18,465.39 | 429.63 | |
| Monthly R1 | 18,886.29 | 420.90 | |
| Weekly R2 | 18,946.56 | 60.28 | Yes! The Weekly R2 is close to the Monthly R1. |
| Monthly R2 | 20,647.60 | 1,701.04 |
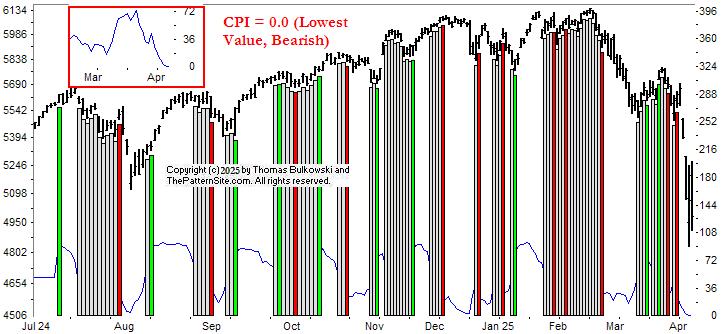
This is a picture of the chart pattern indicator on the daily scale. The indicator is the line chart below a chart of the S&P 500 composite.
As you might expect, the CPI is bearish but it has a 0.0 reading. The scale for the indicator is 100 to 0. It can't get any lower but the indices can continue down.
The red bar on the far right of the chart shows the most recent signal change.
The inset, in the upper left of the chart, shows the CPI line. The good news is that the indicator can go nowhere else but up (or sideways, really).
$ $ $
Here's a symbol list of 234 chart and candlestick patterns (13 "investment grade" candle patterns) found in today's securities using my version of Patternz: ABT, ANF, AYI, AMD, AES, A, APD, ATSG, ALK, ALB, AA, ALKS, DOX, AMED, AEE, AEO, AFG, AMWD, ANIK, AR, APA, AAPL, ADM, ANET, ASH, AVNT, AZTA, BCPC, BALL, BAX, BECN, BZH, BERY, BBY, BIO, BMRN, BKNG, BOOT, BBW, CBT, CAL, CPB, CE, CNC, CENX, CDAY, CRL, CVX, CTAS, CSCO, CLNE, CNX, CGNX, CTSH, CL, CMCO, CAG, COP, COTY, CROX, CCRN, CCK, DHR, DECK, XRAY, DVN, FANG, DDS, ^DJI, D, DUK, EXP, EMN, EIX, EOG, EFX, EL, EVRG, EZPW, FAST, FDX, FIVN, FMC, FORM, FTNT, FTV, GAP, GPN, GFS, GL, GMS, HE, HTLD, HSIC, HSY, HNI, HOLX, HUBG, HUN, IDA, IDXX, ITW, ILMN, ITGR, INTC, IPG, IPI, INTU, JAZZ, JBLU, KSS, KLIC, LZB, LH, LANC, LEG, L, LXU, MHO, M, MGY, MLM, MRK, MLKN, MOS, MUR, MYGN, NBR, NOV, NKE, NOC, OMC, ON, OR, OUT, OMI, PKG, PATK, PTEN, PAYX, PFE, PCG, PPG, PINC, PFG, KWR, DGX, RL, RRC, REGN, RLI, RHI, ROK, ROG, R, SBH, SAND, SLB, SMG, SIGI, SMTC, SCI, SLGN, SKX, SGI, SO, LUV, SPSC, SXI, SCS, SRDX, TGT, TECH, TFX, TXN, TKR, TREX, UIS, UPS, UNH, VFC, VRSN, VC, WRB, WAT, WSO, WLK, WSM, WOLF, ZBRA, IYM, IYK, IEZ, IDU, FXI, IEV, IXC, MXI, ILF, ITB, EWA, EWZ, EEM, EWQ, EWG, EWI, EWM, EPP, EWS, EWY, EWP, EWU, IBB, PBE, PXJ, PJP, PHO, XLP, XHB, XLB, XRT, UNG, USO, VAW. Click this link for details (pattern type, start and end dates).
For a list of small patterns (those a few days wide) click this link.
-- Thomas Bulkowski
![]()
$ $ $
I show another slider trading quiz featuring Ugly double bottom tutorial.
$ $ $
Here's a symbol list of 127 chart and candlestick patterns (13 "investment grade" candle patterns) found in today's securities using my version of Patternz: ABM, ADTN, AKAM, AEE, AFG, AIG, ACGL, AIZ, ADP, AVA, AXS, BIIB, BKNG, BRC, BFH, BR, BG, CPB, COR, CHD, CINF, CLX, CNA, CL, ED, CXW, GLW, CSGP, DTE, DUK, BOOM, EBAY, EG, EXC, FFIV, FIS, FISV, FMC, FWRD, GIS, GNW, GPRO, THG, HIG, HELE, HSY, HNI, HOLX, HON, IDA, INCY, ITGR, INTC, IBKR, JNJ, KMT, KEYS, KMB, LMT, L, LPLA, MGY, MANH, MAN, MGEE, MCO, MOS, NFG, NWL, NEE, NWPX, NUS, OXY, ORI, OLN, OMI, PEN, PNW, PINC, QTWO, DGX, SRE, SKYW, SO, SCCO, SWX, SSYS, SRDX, TPR, TRV, TG, UPS, UNH, V, WEX, XEL, IYK, IYC, FDN, QTEC, FXL, FXI, ICF, IEV, SLV, EWK, ECH, EWQ, EWH, EWI, EWW, EWS, EWU, DBA, PEJ, PJP, XHB, UNG. Click this link for details (pattern type, start and end dates).
For a list of small patterns (those a few days wide) click this link.
$ $ $
The following table shows where Fibonacci retrace values of the day's high-low range are plus pivot points, calculated on the Dow industrials, sorted by value. When several are near each other (small differences), the area might act as support or resistance.
-- Thomas Bulkowski
![]()
| © 2025 ThePatternSite.com Metric | Value | Diff | Close (within 10% of the high-low range for the day)? |
| Monthly S2 | 34,319.17 | ||
| Daily S2 | 35,332.89 | 1,013.72 | |
| Weekly S2 | 35,420.18 | 87.29 | Yes! The Weekly S2 is close to the Daily S2. |
| Monthly S1 | 36,142.39 | 722.21 | |
| Low | 36,611.78 | 469.39 | |
| Daily S1 | 36,649.25 | 37.46 | Yes! The Daily S1 is close to the Low. |
| Weekly S1 | 36,692.89 | 43.64 | Yes! The Weekly S1 is close to the Daily S1. |
| 61.8% Down from Intraday High | 37,603.16 | 910.27 | |
| Open | 37,879.65 | 276.49 | |
| 50% Down from Intraday High | 37,909.40 | 29.75 | Yes! The 50% Down from Intraday High is close to the Open. |
| Daily Pivot | 37,928.13 | 18.73 | Yes! The Daily Pivot is close to the 50% Down from Intraday High. |
| Close | 37,965.60 | 37.47 | Yes! The Close is close to the Daily Pivot. |
| 38.2% Down from Intraday High | 38,215.64 | 250.04 | Yes! The 38.2% Down from Intraday High is close to the Close. |
| High | 39,207.02 | 991.38 | |
| Daily R1 | 39,244.49 | 37.47 | Yes! The Daily R1 is close to the High. |
| Weekly Pivot | 39,537.58 | 293.09 | |
| Monthly Pivot | 40,088.08 | 550.50 | |
| Daily R2 | 40,523.38 | 435.29 | |
| Weekly R1 | 40,810.29 | 286.91 | |
| Monthly R1 | 41,911.30 | 1,101.01 | |
| Weekly R2 | 43,654.98 | 1,743.68 | |
| Monthly R2 | 45,856.99 | 2,202.01 |
$ $ $
I show another slider trading quiz featuring Ugly double bottom tutorial.
$ $ $
Here's a symbol list of 127 chart and candlestick patterns (13 "investment grade" candle patterns) found in today's securities using my version of Patternz: ABM, ADTN, AKAM, AEE, AFG, AIG, ACGL, AIZ, ADP, AVA, AXS, BIIB, BKNG, BRC, BFH, BR, BG, CPB, COR, CHD, CINF, CLX, CNA, CL, ED, CXW, GLW, CSGP, DTE, DUK, BOOM, EBAY, EG, EXC, FFIV, FIS, FISV, FMC, FWRD, GIS, GNW, GPRO, THG, HIG, HELE, HSY, HNI, HOLX, HON, IDA, INCY, ITGR, INTC, IBKR, JNJ, KMT, KEYS, KMB, LMT, L, LPLA, MGY, MANH, MAN, MGEE, MCO, MOS, NFG, NWL, NEE, NWPX, NUS, OXY, ORI, OLN, OMI, PEN, PNW, PINC, QTWO, DGX, SRE, SKYW, SO, SCCO, SWX, SSYS, SRDX, TPR, TRV, TG, UPS, UNH, V, WEX, XEL, IYK, IYC, FDN, QTEC, FXL, FXI, ICF, IEV, SLV, EWK, ECH, EWQ, EWH, EWI, EWW, EWS, EWU, DBA, PEJ, PJP, XHB, UNG. Click this link for details (pattern type, start and end dates).
For a list of small patterns (those a few days wide) click this link.
$ $ $
The following table shows where Fibonacci retrace values of the day's high-low range are plus pivot points, calculated on the Dow industrials, sorted by value. When several are near each other (small differences), the area might act as support or resistance.
-- Thomas Bulkowski
![]()
| © 2025 ThePatternSite.com Metric | Value | Diff | Close (within 10% of the high-low range for the day)? |
| Monthly S2 | 34,319.17 | ||
| Daily S2 | 35,332.89 | 1,013.72 | |
| Weekly S2 | 35,420.18 | 87.29 | Yes! The Weekly S2 is close to the Daily S2. |
| Monthly S1 | 36,142.39 | 722.21 | |
| Low | 36,611.78 | 469.39 | |
| Daily S1 | 36,649.25 | 37.46 | Yes! The Daily S1 is close to the Low. |
| Weekly S1 | 36,692.89 | 43.64 | Yes! The Weekly S1 is close to the Daily S1. |
| 61.8% Down from Intraday High | 37,603.16 | 910.27 | |
| Open | 37,879.65 | 276.49 | |
| 50% Down from Intraday High | 37,909.40 | 29.75 | Yes! The 50% Down from Intraday High is close to the Open. |
| Daily Pivot | 37,928.13 | 18.73 | Yes! The Daily Pivot is close to the 50% Down from Intraday High. |
| Close | 37,965.60 | 37.47 | Yes! The Close is close to the Daily Pivot. |
| 38.2% Down from Intraday High | 38,215.64 | 250.04 | Yes! The 38.2% Down from Intraday High is close to the Close. |
| High | 39,207.02 | 991.38 | |
| Daily R1 | 39,244.49 | 37.47 | Yes! The Daily R1 is close to the High. |
| Weekly Pivot | 39,537.58 | 293.09 | |
| Monthly Pivot | 40,088.08 | 550.50 | |
| Daily R2 | 40,523.38 | 435.29 | |
| Weekly R1 | 40,810.29 | 286.91 | |
| Monthly R1 | 41,911.30 | 1,101.01 | |
| Weekly R2 | 43,654.98 | 1,743.68 | |
| Monthly R2 | 45,856.99 | 2,202.01 |
I thought that Trump would start a war to remain in office. I didn't think he'd start World War 3.
This war is not fought (yet) with bombs or nukes. It's a trade war. He said he'd end all wars, especially the Ukraine-Russia war on day 1. He didn't do that. Instead, he hasn't ruled out military action against Greenland, Panama, and would love to adopt Canada as our 51st state.
Some estimates say it'll take 3 to 5 years to build a factory in the US (Trump says 2 years). You have to find a property to buy. Get it zoned properly. Maybe file an environmental impact statement that could be challenged in court, build roads, rail lines, a factory, train people. Yes, three or more years sounds reasonable.
Three years is about the time Trump's term will be up. So you get your new plant up and running just in time for a pissed-off electorate to bring in a democrat who removes tariffs. All of a sudden, your new factory costs three times as much to produce your goody as Vietnam or China. You've made a very expensive mistake.
Do you understand the uncertainty CEOs face now?
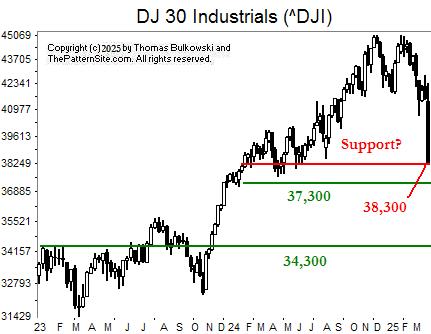
Let's turn to the chart. I show the Dow industrials on the weekly scale.
The red line shows where we are now, at 38,300. Below that, the green lines show support at 37,300 and 34,300. I'd like to say that the lines represent where price is likely to reverse, but with the political climate what it is, I can't predict what will happen. We could see a rebound on Monday or it could continue down for more massive plunges. I can't even recommend that you buy more at this level. It might be a lot cheaper soon.
![]()
The following is a brief review of how the markets performed over time. The numbers refer to the close-to-close move in the Dow industrials.
No options expire this week.
![]()
The following is based on an SFO article in December 2004 by John Seekinger, titled, "Take a two-dimensional approach." He offers these tips.
| Index | S2 | S1 | Pivot | R1 | R2 |
| Dow Industrials (^DJI): Daily | 37,060 | 37,687 | 38,893 | 39,520 | 40,726 |
| Weekly | 35,537 | 36,926 | 39,654 | 41,043 | 43,771 |
| Monthly | 34,436 | 36,375 | 40,205 | 42,144 | 45,973 |
| S&P500 (^GSPC): Daily | 4,923 | 4,999 | 5,145 | 5,221 | 5,368 |
| Weekly | 4,654 | 4,864 | 5,280 | 5,490 | 5,905 |
| Monthly | 4,461 | 4,767 | 5,377 | 5,683 | 6,293 |
| Nasdaq (^IXIC): Daily | 15,211 | 15,400 | 15,764 | 15,952 | 16,316 |
| Weekly | 14,152 | 14,870 | 16,293 | 17,011 | 18,434 |
| Monthly | 13,302 | 14,445 | 16,719 | 17,862 | 20,135 |
Here are the formulas:
![]()
Earnings season will be starting in about 9 days.
Here's a symbol list of 407 chart and candlestick patterns (13 "investment grade" candle patterns) found in today's securities using my version of Patternz: DDD, MMM, ABM, ADBE, AEIS, AMD, AES, A, APD, ATSG, ALRM, ALK, ALB, AA, ALKS, DOX, AEO, AXP, AME, AMGN, APH, APA, AAPL, AMAT, ADM, ANET, ARW, ASH, AIZ, AGO, ADP, AVNT, AZTA, BMI, BCPC, BAX, BZH, BIO, BIIB, BMRN, BKH, BA, BKNG, BSX, BMY, CPB, CE, CLS, CX, COR, CENX, CDAY, CF, CHKP, CVX, CHD, CINF, CTAS, CSCO, CLF, CLX, CNO, CGNX, CTSH, CL, CMCO, ED, COP, CXW, GLW, CSGP, CR, CRH, CCK, CTS, CMI, CW, DHR, DVN, FANG, ^DJU, ^DJT, ^DJI, DOV, DTE, DUK, BOOM, EMN, EBAY, EIX, EME, EMR, EOG, EPAM, EL, EG, EXC, XOM, FFIV, FARO, FDX, FISV, FIVN, FLEX, FLS, FMC, FORM, FTNT, FTV, FCX, IT, GE, GIS, GNW, GILD, GPN, GFS, GL, GS, GOOGL, GPRO, GGG, GFF, HLIT, HE, HQY, HL, HELE, HP, HSY, HNI, DHI, HWM, HUN, HURC, IEX, ITW, ILMN, INCY, IBP, IPAR, IBKR, TILE, IPG, IPI, JAZZ, JBLU, KALU, K, KMT, KEYS, KMB, KLAC, KLIC, LRCX, LANC, LLY, LNC, RAMP, L, LPLA, LXU, MHO, MTSI, MGY, MANH, MAN, MKTX, MA, MTDR, MTRN, MTRX, MRK, META, MGEE, MU, MCO, MS, MOS, MLI, MUR, NBR, ^IXIC, NOV, NTGR, NTAP, NWL, NEE, NI, JWN, NWPX, NOVT, NUS, NTNX, NVDA, OXY, OGE, ORI, OLN, OMC, OTEX, ORCL, OUT, OMI, PKG, PANW, PKE, PTEN, PYPL, PEN, PFE, PLXS, PPG, PFG, PRU, PSTG, QTWO, KWR, QCOM, RMBS, RJF, RTX, RGA, RHI, ROK, RES, R, ^GSPC, CRM, SAND, SLB, SCHW, SEE, SEIC, SMTC, NOW, SHOP, SLGN, STR, SKYW, SGI, SO, SCCO, LUV, SWX, SXI, SSYS, TPR, TRGP, TECH, TDY, TDC, TER, TEVA, TXN, TXT, TTD, TMO, TKR, RIG, TZOO, TG, TWLO, UGI, UIS, UPS, UNH, UNM, VLO, VMI, MDRX, VRTX, V, VC, WLK, WEX, WSC, WWD, XEL, ZBRA, ITA, IYM, IAI, IYC, IYE, IEZ, IHE, IDU, DDM, FTEC, FDN, QTEC, FXL, FXI, BOTZ, QQQ, IYH, IAT, IEV, IGV, IXC, MXI, IXN, SOXX, SLV, IGE, IEO, IYF, ITB, EWO, ECH, EEM, EWQ, EWG, EWH, EIS, EWI, EWJ, EWM, EWW, EPP, EZA, EWY, EWD, EWL, EWT, THD, TUR, EWU, QLD, IBB, PBE, PEJ, PXJ, PJP, PHO, SSO, ROBO, XLY, XLE, XLF, XLV, XHB, XLI, XLB, SPY, XLK, XLU, USO, SMH, VHT, VIS, VAW, MGK, VONG. Click this link for details (pattern type, start and end dates).
For a list of small patterns (those a few days wide) click this link.
The below industries were the best (rank 1) or worst performing of those I follow.
|
-- Thomas Bulkowski
![]()
Here's a symbol list of 229 chart and candlestick patterns (13 "investment grade" candle patterns) found in today's securities using my version of Patternz: MMM, ADBE, ADTN, AEIS, AMD, AES, ALB, AA, AEP, AXP, AME, APH, ARW, ASH, AIZ, AVNT, BCPC, BAX, BZH, BKH, BA, BOOT, BFH, BLDR, BG, CE, CLS, COR, CENX, CDAY, CVX, CHD, CTSH, CL, CMTL, ED, GLW, CSGP, CR, CTS, XRAY, DDS, ^DJU, ^DJT, ^DJI, DOV, EMN, EIX, EMR, EPAM, EVH, EXC, XOM, EZPW, FFIV, FARO, FDX, FIVN, FLS, FMC, FTNT, FTV, FWRD, FNV, FCX, GME, GAP, GE, GIS, GILD, GPRO, GES, HELE, HNI, DHI, HOV, HUBG, HUN, HURC, IBP, INTC, IPAR, IPG, KALU, KBH, KMT, KEYS, KMB, KSS, LHX, LRCX, LANC, LDOS, RAMP, LPLA, LXU, MHO, M, MKTX, MTDR, MTRN, MTRX, MGEE, MLKN, MS, MUR, NBR, NWL, NI, NWPX, NOVT, NTNX, NVDA, OGE, OUT, OMI, OXM, PTEN, PETS, PFE, PNW, PLXS, PINC, PGR, PRU, PHM, QTWO, QCOM, RJF, REGN, RGA, ROK, ROG, ^GSPC, CRM, SAND, SCHW, SMG, SEE, STR, SKX, SKYW, SO, SCCO, LUV, SXI, SSYS, TPR, TDC, TER, TXN, TXT, TKR, TDG, TZOO, TG, UPS, UNH, VFC, V, WU, WLK, WWW, XEL, ZBRA, IYM, IYK, IYC, IDU, DDM, FDN, QTEC, FXL, FXI, IAT, IXC, MXI, ILF, SLV, ITB, EWZ, EWH, EWI, EWJ, EWW, EWS, EZA, EWY, EWP, EWD, SSO, ROBO, XLY, XLE, XLF, XHB, XLB, SPY, XLU, VAW. Click this link for details (pattern type, start and end dates).
For a list of small patterns (those a few days wide) click this link.
$ $ $
You can find setups based on a Fibonacci retrace by clicking on the link.
The following patterns were found manually, not using Patternz. Mr. Bulkowski has excluded any securities he owns from appearing in the list. However, he may add any of the securities listed to his portfolio at any time, just as you can.
In the table below, the red and green colors are based on the historical breakout direction for the associated chart pattern. If a high and tight flag appears, the start and end dates highlight the flagpole only and not the flag.
For details about the chart patterns, click here.
-- Thomas Bulkowski, author: Invest for Two-Comma Wealth and the novel (fiction), Foresight (#Ad)
![]()
| Symbol | Chart Pattern | Bullish Bearish | Start | End | Industry |
| MMM | Head-and-shoulders top | 01/31/2025 | 03/25/2025 | Diversified Co. | |
| ANF | Double Top, Eve and Adam | 03/20/2025 | 04/02/2025 | Apparel | |
| AKAM | Double Top, Eve and Eve | 03/17/2025 | 03/25/2025 | E-Commerce | |
| ALB | Double Top, Eve and Adam | 03/10/2025 | 03/19/2025 | Chemical (Diversified) | |
| ALKS | Double Top, Eve and Adam | 03/11/2025 | 03/24/2025 | Drug | |
| AEO | Triple top | 03/07/2025 | 04/02/2025 | Apparel | |
| AEP | Triple bottom | 03/06/2025 | 03/25/2025 | Electric Utility (Central) | |
| AME | Double Top, Adam and Eve | 03/17/2025 | 03/26/2025 | Industrial Services | |
| BBY | Double Top, Eve and Adam | 03/24/2025 | 04/02/2025 | Retail (Special Lines) | |
| BMRN | Double Top, Adam and Adam | 03/07/2025 | 03/27/2025 | Biotechnology | |
| BOOT | Dead-cat bounce | 04/03/2025 | 04/03/2025 | Shoe | |
| BFH | Double Top, Eve and Adam | 03/25/2025 | 04/02/2025 | Information Services | |
| BMY | Double Top, Eve and Adam | 03/25/2025 | 03/31/2025 | Drug | |
| BR | Pipe bottom | 03/10/2025 | 03/17/2025 | Information Services | |
| CACI | Double Bottom, Adam and Adam | 03/21/2025 | 04/02/2025 | IT Services | |
| CHKP | Broadening top | 03/18/2025 | 04/03/2025 | E-Commerce | |
| CVX | Double Top, Adam and Adam | 03/26/2025 | 03/31/2025 | Petroleum (Integrated) | |
| COST | Pipe bottom | 03/10/2025 | 03/17/2025 | Retail Store | |
| CR | Double Top, Adam and Eve | 03/12/2025 | 03/26/2025 | Diversified Co. | |
| CROX | Double Top, Eve and Adam | 03/25/2025 | 04/02/2025 | Shoe | |
| CTS | Double Top, Adam and Eve | 03/07/2025 | 03/25/2025 | Electronics | |
| DHR | Head-and-shoulders top | 02/21/2025 | 03/24/2025 | Medical Services | |
| DSGR | Double Top, Eve and Eve | 02/26/2025 | 03/10/2025 | Metal Fabricating | |
| EOG | Double Top, Adam and Adam | 03/26/2025 | 04/02/2025 | Natural Gas (Distributor) | |
| EFX | Double Top, Eve and Adam | 03/24/2025 | 04/02/2025 | Information Services | |
| EVRG | Head-and-shoulders bottom | 02/20/2025 | 03/25/2025 | Electric Utility (Central) | |
| EXC | Triple bottom | 03/06/2025 | 03/25/2025 | Electric Utility (East) | |
| FDS | Double Bottom, Adam and Adam | 03/12/2025 | 03/21/2025 | Information Services | |
| FARO | Double Top, Eve and Eve | 01/31/2025 | 02/26/2025 | Precision Instrument | |
| FMC | Head-and-shoulders top | 03/10/2025 | 03/28/2025 | Chemical (Basic) | |
| FWRD | Dead-cat bounce | 04/03/2025 | 04/03/2025 | Trucking/Transp. Leasing | |
| GAP | Dead-cat bounce | 04/03/2025 | 04/03/2025 | Apparel | |
| GE | Double Top, Eve and Adam | 02/18/2025 | 03/26/2025 | Diversified Co. | |
| GPN | Double Top, Eve and Adam | 03/26/2025 | 04/02/2025 | Computer Software and Svcs | |
| GGG | Double Top, Eve and Adam | 03/26/2025 | 04/02/2025 | Machinery | |
| HL | Head-and-shoulders top | 03/18/2025 | 03/28/2025 | Metals and Mining (Div.) | |
| IDA | Double Bottom, Adam and Adam | 03/06/2025 | 03/25/2025 | Electric Utility (West) | |
| ITW | Pipe top | 03/03/2025 | 03/10/2025 | Metal Fabricating | |
| IRM | Head-and-shoulders top | 03/17/2025 | 04/02/2025 | Industrial Services | |
| JAZZ | Double Top, Adam and Adam | 03/19/2025 | 03/24/2025 | Biotechnology | |
| KELYA | Head-and-shoulders top | 03/10/2025 | 03/27/2025 | Human Resources | |
| KMT | Double Top, Adam and Adam | 03/10/2025 | 03/25/2025 | Metal Fabricating | |
| KFRC | Double Top, Adam and Adam | 03/27/2025 | 04/02/2025 | Human Resources | |
| KSS | Dead-cat bounce | 04/03/2025 | 04/03/2025 | Retail Store | |
| LEN | Head-and-shoulders top | 02/25/2025 | 03/20/2025 | Homebuilding | |
| M | Triangle, symmetrical | 03/03/2025 | 03/25/2025 | Retail Store | |
| MANH | Head-and-shoulders top | 03/17/2025 | 04/02/2025 | IT Services | |
| MAN | Diamond bottom | 03/24/2025 | 04/02/2025 | Human Resources | |
| MTRN | Double Top, Eve and Eve | 03/18/2025 | 03/26/2025 | Metals and Mining (Div.) | |
| NVDA | Double Top, Adam and Adam | 03/17/2025 | 03/24/2025 | Semiconductor | |
| OLN | Triple top | 03/19/2025 | 03/28/2025 | Chemical (Basic) | |
| ORCL | Double Top, Adam and Eve | 03/17/2025 | 03/24/2025 | Computer Software and Svcs | |
| PATK | Double Top, Eve and Adam | 03/25/2025 | 04/02/2025 | Retail Building Supply | |
| PTEN | Head-and-shoulders top | 03/19/2025 | 04/02/2025 | Oilfield Svcs/Equipment | |
| PPL | Double Bottom, Eve and Adam | 03/06/2025 | 03/25/2025 | Electric Utility (East) | |
| PFG | Head-and-shoulders top | 02/14/2025 | 03/26/2025 | Insurance (Diversified) | |
| PHM | Head-and-shoulders top | 02/25/2025 | 03/20/2025 | Homebuilding | |
| RL | Double Top, Eve and Adam | 03/24/2025 | 04/02/2025 | Apparel | |
| RJF | Double Top, Adam and Adam | 03/19/2025 | 03/26/2025 | Securities Brokerage | |
| RNG | Double Top, Adam and Adam | 03/07/2025 | 03/25/2025 | Computer Software and Svcs | |
| RHI | Triangle, ascending | 03/19/2025 | 04/02/2025 | Human Resources | |
| ROK | Double Top, Eve and Adam | 03/07/2025 | 03/26/2025 | Diversified Co. | |
| RES | Double Top, Adam and Adam | 03/26/2025 | 04/02/2025 | Oilfield Svcs/Equipment | |
| R | Pipe bottom | 03/10/2025 | 03/17/2025 | Trucking/Transp. Leasing | |
| SCI | Double Bottom, Eve and Eve | 03/13/2025 | 03/25/2025 | Industrial Services | |
| SKX | Dead-cat bounce | 04/03/2025 | 04/03/2025 | Shoe | |
| SNPS | Double Top, Adam and Eve | 03/17/2025 | 03/24/2025 | Computer Software and Svcs | |
| TPR | Double Top, Eve and Adam | 03/24/2025 | 04/02/2025 | Apparel | |
| TRGP | Double Top, Eve and Adam | 03/25/2025 | 04/02/2025 | Natural Gas (Diversified) | |
| TXT | Double Top, Eve and Eve | 03/17/2025 | 03/27/2025 | Diversified Co. | |
| TKR | Double Top, Eve and Eve | 03/07/2025 | 03/25/2025 | Metal Fabricating | |
| TJX | Pipe bottom | 03/10/2025 | 03/17/2025 | Retail Store | |
| RIG | Broadening top | 03/18/2025 | 04/01/2025 | Oilfield Svcs/Equipment | |
| UHAL | Double Bottom, Adam and Adam | 03/13/2025 | 03/21/2025 | Trucking/Transp. Leasing | |
| VFC | Dead-cat bounce | 04/03/2025 | 04/03/2025 | Apparel | |
| VEEV | Head-and-shoulders top | 02/06/2025 | 03/25/2025 | Healthcare Information | |
| WOLF | Dead-cat bounce | 03/28/2025 | 03/28/2025 | Semiconductor | |
| WWW | Pipe bottom | 03/10/2025 | 03/17/2025 | Shoe | |
| WWD | Head-and-shoulders top | 03/19/2025 | 04/02/2025 | Precision Instrument | |
| XEL | Double Bottom, Eve and Adam | 03/06/2025 | 03/25/2025 | Electric Utility (West) |
![]()
$ $ $

I show a picture of the Nasdaq composite on the 5-minute scale.
There's not a lot to talk about in the chart. I drew an upward-sloping trendline along the bottoms. It cuts through A, which is a downward spike that I didn't see at first.
The top line connects the peaks. The pattern the two lines form is called an ascending broadening wedge.
The pattern ends, or appears to end, with a downward breakout at A. I can't see where price closed, so I'm not sure if that's the actual breakout. (To avoid false breakouts, for statistics, I wait for a close outside the trendline borders. For trading, I use a pierce to trigger an entry or exit from a trade).
Ascending broadening wedges breakout downward 52% of the time, which is close to random.
What does this tell us about trading in the coming days? The pattern is slightly bearish. Now that tariffs have been announced, the markets might react to that news negatively (because they dislike the policy) or positively (because it clears away uncertainty). I don't know which will happen.
Addendum: The futures are down big. Dow off 1,000 points or 2.2%, Nasdaq down 4.1% and S&P down 3.2% according to CNBC.
$ $ $
Here's a symbol list of 102 chart and candlestick patterns (13 "investment grade" candle patterns) found in today's securities using my version of Patternz: AES, AFL, ALK, ALGT, AIG, AMWD, AVNT, BIO, BRC, BCO, CAL, COR, CNC, CDAY, CHD, CNX, CTSH, GLW, CTS, DHR, XRAY, ^DJU, EIX, ELV, EPAM, FARO, FDX, FIS, FLS, FMC, GIS, GILD, GPRO, HQY, HSY, IDA, TILE, IPG, KELYA, KMT, KSS, LAMR, LEG, LDOS, LLY, LXU, MTRN, MS, MOS, NOVT, NTNX, OMC, OR, OMI, OXM, PATK, PETS, PNW, PINC, PRU, DGX, RMBS, RJF, RNG, RHI, RCKY, ROG, SAIA, SEIC, STR, SO, SCCO, SSYS, TDY, TJX, TG, VRSN, WERN, WLK, WSC, WDAY, ZBRA, IYM, IYC, IDU, IHI, EWA, EWK, EWH, EWW, EWD, PBE, PJP, ROBO, XLB, XLU, USO, VAW. Click this link for details (pattern type, start and end dates).
For a list of small patterns (those a few days wide) click this link.
$ $ $
The following table shows where Fibonacci retrace values of the day's high-low range are plus pivot points, calculated on the Nasdaq composite, sorted by value. When several are near each other (small differences), the area might act as support or resistance.
-- Thomas Bulkowski
![]()
| © 2025 ThePatternSite.com Metric | Value | Diff | Close (within 10% of the high-low range for the day)? |
| Monthly S2 | 15,755.18 | ||
| Monthly S1 | 16,678.12 | 922.93 | |
| Weekly S2 | 16,723.68 | 45.56 | Yes! The Weekly S2 is close to the Monthly S1. |
| Daily S2 | 16,964.36 | 240.69 | |
| Weekly S1 | 17,162.36 | 198.00 | |
| Low | 17,181.27 | 18.91 | Yes! The Low is close to the Weekly S1. |
| Open | 17,207.01 | 25.74 | Yes! The Open is close to the Low. |
| Daily S1 | 17,282.71 | 75.70 | |
| 61.8% Down from Intraday High | 17,385.74 | 103.03 | |
| 50% Down from Intraday High | 17,448.89 | 63.16 | |
| Daily Pivot | 17,499.61 | 50.72 | Yes! The Daily Pivot is close to the 50% Down from Intraday High. |
| 38.2% Down from Intraday High | 17,512.05 | 12.44 | Yes! The 38.2% Down from Intraday High is close to the Daily Pivot. |
| Close | 17,601.05 | 89.00 | |
| High | 17,716.52 | 115.47 | |
| Weekly Pivot | 17,721.75 | 5.23 | Yes! The Weekly Pivot is close to the High. |
| Daily R1 | 17,817.96 | 96.21 | |
| Daily R2 | 18,034.86 | 216.91 | |
| Weekly R1 | 18,160.43 | 125.57 | |
| Monthly Pivot | 18,161.17 | 0.74 | Yes! The Monthly Pivot is close to the Weekly R1. |
| Weekly R2 | 18,719.82 | 558.64 | |
| Monthly R1 | 19,084.11 | 364.29 | |
| Monthly R2 | 20,567.16 | 1,483.06 |

This is a picture of the chart pattern indicator on the daily scale. The indicator is the line chart below a chart of the S&P 500 composite.
Not much has changed in the chart since yesterday's post except that the CPI has turned neutral (white bar on far right of chart). The reading is 52.4.
Yesterday, the indicator was bullish but signals can change for up to a week. However, the change shows weakness in the overall market.
You can see the CPI dip in the inset, upper left of chart.
$ $ $
Here's a symbol list of 82 chart and candlestick patterns (13 "investment grade" candle patterns) found in today's securities using my version of Patternz: ANF, ACN, AES, AFL, ALGT, AMN, AAPL, ADSK, AZTA, BSET, BIIB, BMRN, BA, BSX, BFH, BRKR, CDNS, CRL, CHD, CLF, CNX, CMTL, COP, GLW, DHR, DVN, ^DJU, ELV, FISV, GIS, GILD, GS, GOOGL, GPRO, HLIT, HP, HSY, PODD, ITGR, IPG, IRM, KSS, LDOS, MGY, MTDR, MS, MOS, NOV, NTNX, ORI, OMC, OXM, PCG, PG, R, SCCO, TRGP, TKR, UIS, UPS, WMT, WMB, WWD, IYE, IHE, IDU, IYH, IXC, IEO, EWK, EWZ, EWH, IBB, DBA, XLE, XLV, XRT, XLU. Click this link for details (pattern type, start and end dates).
For a list of small patterns (those a few days wide) click this link.
-- Thomas Bulkowski
![]()
$ $ $
Here's the updated 2025 market forecast, presented in slider format.
$ $ $
Here's a symbol list of 171 chart and candlestick patterns (13 "investment grade" candle patterns) found in today's securities using my version of Patternz: ABT, ADTN, AES, AFL, ATSG, ALRM, ALK, ALGT, AMZN, AEO, AEP, AXP, AIG, AMN, APH, ARCB, AXS, BALL, BSET, BZH, BIIB, BMRN, BKH, BA, BKNG, BOOT, BRC, BR, BBW, CDNS, CLS, CX, COR, CENX, CF, CRL, CHKP, CIEN, CINF, CSCO, CLF, CLX, CMTL, COST, CR, XRAY, DTE, DUK, EBAY, EME, EMR, EVRG, EXC, EXPD, FFIV, FDS, FDX, FISV, FTNT, FCX, GME, GIS, GL, GPRO, HIG, HL, HD, DHI, HUN, NSP, IBP, IBKR, JBLU, JNJ, KEYS, KSS, LEG, L, LOW, LXU, M, MDT, MU, NFG, NWL, NEU, NTNX, ORI, OMC, OMI, PINC, PHM, PSTG, RMBS, RNG, R, ^GSPC, CRM, SCI, SHW, SHOP, SKX, SCS, SNPS, TPR, TDC, TTD, TJX, UPS, VRSN, VRTX, V, WU, WWW, XEL, IEZ, FDN, QTEC, FXL, BOTZ, IHF, IEV, IGV, ITB, IHI, EWA, EWO, EWK, EWQ, EWG, EWH, EIS, EWI, EWJ, EWY, EWD, EWL, EWT, THD, IBB, PBE, SSO, ROBO, GLD, XHB, SPY, USO. Click this link for details (pattern type, start and end dates).
For a list of small patterns (those a few days wide) click this link.
$ $ $
The following table shows where Fibonacci retrace values of the day's high-low range are plus pivot points, calculated on the Dow industrials, sorted by value. When several are near each other (small differences), the area might act as support or resistance.
-- Thomas Bulkowski
![]()
| © 2025 ThePatternSite.com Metric | Value | Diff | Close (within 10% of the high-low range for the day)? |
| Monthly S2 | 38,860.43 | ||
| Monthly S1 | 40,431.09 | 1,570.67 | |
| Daily S2 | 40,766.51 | 335.41 | |
| Weekly S2 | 40,826.04 | 59.53 | Yes! The Weekly S2 is close to the Daily S2. |
| Low | 41,148.13 | 322.09 | |
| Open | 41,382.52 | 234.39 | |
| Daily S1 | 41,384.13 | 1.61 | Yes! The Daily S1 is close to the Open. |
| Weekly S1 | 41,413.90 | 29.77 | Yes! The Weekly S1 is close to the Daily S1. |
| 61.8% Down from Intraday High | 41,529.84 | 115.95 | |
| 50% Down from Intraday High | 41,647.75 | 117.91 | |
| 38.2% Down from Intraday High | 41,765.67 | 117.91 | |
| Daily Pivot | 41,765.76 | 0.09 | Yes! The Daily Pivot is close to the 38.2% Down from Intraday High. |
| Close | 42,001.76 | 236.00 | |
| Weekly Pivot | 42,117.86 | 116.10 | |
| High | 42,147.38 | 29.52 | Yes! The High is close to the Weekly Pivot. |
| Monthly Pivot | 42,232.44 | 85.06 | Yes! The Monthly Pivot is close to the High. |
| Daily R1 | 42,383.38 | 150.95 | |
| Weekly R1 | 42,705.73 | 322.34 | |
| Daily R2 | 42,765.01 | 59.28 | Yes! The Daily R2 is close to the Weekly R1. |
| Weekly R2 | 43,409.69 | 644.68 | |
| Monthly R1 | 43,803.10 | 393.41 | |
| Monthly R2 | 45,604.45 | 1,801.34 |
Support this site! Clicking any of the books (below) takes you to
Amazon.com If you buy ANYTHING while there, they pay for the referral.
Legal notice for paid links: "As an Amazon Associate I earn from qualifying purchases."
|
My Stock Market Books
|
My Novels
Orb Foresight Rewrite Coming!
|