
As of 04/06/2026
Indus: 46,670 +165.21 +0.4%
Trans: 19,296 +207.46 +1.1%
Utils: 1,168 -5.51 -0.5%
Nasdaq: 21,996 +117.16 +0.5%
S&P 500: 6,612 +29.14 +0.4%
|
YTD
-2.9%
+11.2%
+9.4%
-5.4%
-3.4%
|
|
As of 04/06/2026
Indus: 46,670 +165.21 +0.4%
Trans: 19,296 +207.46 +1.1%
Utils: 1,168 -5.51 -0.5%
Nasdaq: 21,996 +117.16 +0.5%
S&P 500: 6,612 +29.14 +0.4%
|
YTD
-2.9%
+11.2%
+9.4%
-5.4%
-3.4%
| |
|
| ||
$ $ $
Here's a symbol list of 233 chart and candlestick patterns (13 "investment grade" candle patterns) found in today's securities using my version of Patternz: MMM, AXDX, ACN, AYI, ADTN, AJRD, AES, ALB, ALGT, AYX, AMZN, DOX, AEL, AFG, AIG, ANIK, APA, APOG, AAPL, ACGL, ARW, AIZ, AGO, AVNT, BECN, BBBY, BAH, BCO, BR, CBT, CX, CF, CVX, CIEN, CINF, CTAS, CLNE, CNA, CNO, ED, COP, CRH, CCRN, CTS, CMI, DDS, DOV, ECL, EMR, EOG, EPAM, EL, RE, XOM, FICO, FAST, FLS, FCX, IT, GL, GMS, GS, GGG, GFF, HIG, HQY, HL, HOV, JBHT, INFN, IBP, IIIN, ITGR, IBKR, TILE, INTU, KALU, KEYS, KLAC, LPLA, LXU, M, MGY, MRO, MLM, MAS, MRCY, MSFT, MUR, MYGN, ^IXIC, NOV, NFLX, NEWR, JWN, NOC, NVDA, OLN, OMC, PKG, PAYX, PKI, PXD, PFG, PGR, PRU, PEG, QCOM, RRC, RJF, REGN, RGS, RGA, RNG, ROK, RES, ^GSPC, SBH, SMG, SMTC, STR, SKYW, SMAR, SCCO, LUV, SPSC, SRDX, TRGP, TDOC, TPX, TSCO, TG, UHAL, SLCA, UIS, UNM, VFC, VRTX, VC, WMT, WSO, WLK, WDAY, IYM, IYC, ITB, IDU, FTEC, FDN, QTEC, FXL, FXI, BOTZ, ICF, IAT, IGV, SOXX, SLV, IEO, IHI, EWA, EWO, EWK, EWC, ECH, EEM, EWQ, EWG, EWH, EWI, EWJ, EWW, EPP, EWS, EZA, EWY, EWP, EWD, EWL, EWU, QLD, DBA, PBE, PEJ, PHO, ROBO, IEV, IXC, IXN, SSO, MXI, XLY, XLE, XLB, SPY, XLK, USO, SMH, VIS, VAW, MGK. Click this link for details (pattern type, start and end dates).
For a list of small patterns (those a few days wide) click this link.
$ $ $
You can find setups based on a Fibonacci retrace by clicking on the link.
The following patterns were found manually, not using Patternz. Mr. Bulkowski has excluded any securities he owns from appearing in the list. However, he may add any of the securities listed to his portfolio at any time, just as you can.
In the table below, the red and green colors are based on the historical breakout direction for the associated chart pattern. If a high and tight flag appears, the start and end dates highlight the flagpole only and not the flag.
For details about the chart patterns, click here.
-- Thomas Bulkowski
![]()
| Symbol | Chart Pattern | Bullish Bearish | Start | End | Industry |
| ABT | Rectangle bottom | 03/10/2023 | 03/30/2023 | Medical Supplies | |
| APA | Pipe bottom | 03/13/2023 | 03/13/2023 | Petroleum (Producing) | |
| APOG | Double Bottom, Adam and Adam | 03/17/2023 | 03/24/2023 | Building Materials | |
| ATR | Double Bottom, Eve and Adam | 03/16/2023 | 03/24/2023 | Packaging and Container | |
| ACGL | Pipe bottom | 03/13/2023 | 03/20/2023 | Insurance (Prop/Casualty) | |
| ADM | Double Bottom, Adam and Adam | 03/17/2023 | 03/24/2023 | Food Processing | |
| ARW | Head-and-shoulders bottom | 02/24/2023 | 03/24/2023 | Electronics | |
| ASH | Double Bottom, Eve and Adam | 03/16/2023 | 03/24/2023 | Chemical (Basic) | |
| AVNT | Double Bottom, Eve and Adam | 03/15/2023 | 03/24/2023 | Chemical (Specialty) | |
| BMRN | Head-and-shoulders bottom | 03/10/2023 | 03/24/2023 | Biotechnology | |
| BA | Double Bottom, Adam and Adam | 03/15/2023 | 03/24/2023 | Aerospace/Defense | |
| BCO | Pipe bottom | 03/13/2023 | 03/20/2023 | Industrial Services | |
| CBT | Double Bottom, Eve and Adam | 03/16/2023 | 03/24/2023 | Chemical (Diversified) | |
| CX | Pipe bottom | 03/13/2023 | 03/20/2023 | Cement and Aggregates | |
| CNC | Diamond bottom | 03/15/2023 | 03/30/2023 | Medical Services | |
| CVX | Double Bottom, Eve and Adam | 03/16/2023 | 03/24/2023 | Petroleum (Integrated) | |
| CSCO | Double Bottom, Eve and Eve | 03/01/2023 | 03/13/2023 | Computers and Peripherals | |
| COP | Double Bottom, Adam and Adam | 03/16/2023 | 03/24/2023 | Petroleum (Integrated) | |
| CCK | Double Bottom, Eve and Eve | 03/17/2023 | 03/24/2023 | Packaging and Container | |
| FANG | Double Bottom, Eve and Adam | 03/16/2023 | 03/24/2023 | Petroleum (Producing) | |
| EIX | Double Bottom, Adam and Adam | 03/13/2023 | 03/23/2023 | Electric Utility (West) | |
| EMR | Head-and-shoulders bottom | 02/24/2023 | 03/24/2023 | Computers and Peripherals | |
| EOG | Pipe bottom | 03/13/2023 | 03/20/2023 | Natural Gas (Distributor) | |
| EXPI | Head-and-shoulders bottom | 03/01/2023 | 03/22/2023 | E-Commerce | |
| FAST | Triangle, symmetrical | 02/24/2023 | 03/30/2023 | Retail Building Supply | |
| FRD | Triangle, symmetrical | 03/17/2023 | 03/30/2023 | Building Materials | |
| GPN | Double Bottom, Eve and Adam | 03/15/2023 | 03/24/2023 | Computer Software and Svcs | |
| HAYN | Pennant | 03/17/2023 | 03/30/2023 | Building Materials | |
| HNI | Triangle, symmetrical | 03/08/2023 | 03/24/2023 | Furn/Home Furnishings | |
| IEX | Double Bottom, Eve and Adam | 03/15/2023 | 03/24/2023 | Machinery | |
| ITGR | Diamond top | 02/28/2023 | 03/21/2023 | Electronics | |
| KMT | Double Bottom, Adam and Adam | 03/17/2023 | 03/24/2023 | Metal Fabricating | |
| LH | Double Bottom, Adam and Adam | 03/17/2023 | 03/24/2023 | Medical Services | |
| LMT | Triangle, symmetrical | 03/14/2023 | 03/30/2023 | Aerospace/Defense | |
| MANH | Pipe bottom | 03/06/2023 | 03/13/2023 | IT Services | |
| MLM | Pipe bottom | 03/13/2023 | 03/20/2023 | Cement and Aggregates | |
| MDC | Pipe bottom | 03/06/2023 | 03/13/2023 | Homebuilding | |
| MRCY | Pipe bottom | 03/13/2023 | 03/20/2023 | Computers and Peripherals | |
| NFG | Double Bottom, Eve and Adam | 03/16/2023 | 03/24/2023 | Natural Gas (Diversified) | |
| NOC | Double Bottom, Eve and Eve | 03/15/2023 | 03/23/2023 | Aerospace/Defense | |
| OGE | Double Bottom, Adam and Adam | 03/10/2023 | 03/24/2023 | Electric Utility (Central) | |
| OLN | Pipe bottom | 03/13/2023 | 03/20/2023 | Chemical (Basic) | |
| PAYX | Double Bottom, Eve and Adam | 03/16/2023 | 03/23/2023 | IT Services | |
| PXD | Pipe bottom | 03/13/2023 | 03/20/2023 | Petroleum (Producing) | |
| PGR | Pipe bottom | 03/13/2023 | 03/20/2023 | Insurance (Prop/Casualty) | |
| PEG | Double Bottom, Adam and Adam | 03/13/2023 | 03/23/2023 | Electric Utility (East) | |
| KWR | Double Bottom, Eve and Adam | 03/17/2023 | 03/24/2023 | Chemical (Specialty) | |
| RL | Double Bottom, Adam and Adam | 03/15/2023 | 03/24/2023 | Apparel | |
| RMBS | Pipe bottom | 01/30/2023 | 02/06/2023 | Semiconductor Cap Equip. | |
| RGA | Pipe bottom | 03/13/2023 | 03/20/2023 | Insurance (Life) | |
| ROK | Double Bottom, Eve and Adam | 03/17/2023 | 03/24/2023 | Diversified Co. | |
| ROL | Double Bottom, Adam and Adam | 03/01/2023 | 03/13/2023 | Industrial Services | |
| SAIC | Double Bottom, Eve and Adam | 03/17/2023 | 03/24/2023 | IT Services | |
| SMTC | Dead-cat bounce | 03/30/2023 | 03/30/2023 | Semiconductor Cap Equip. | |
| SKYW | Pipe bottom | 03/13/2023 | 03/20/2023 | Air Transport | |
| SCCO | Pipe bottom | 03/13/2023 | 03/20/2023 | Metals and Mining (Div.) | |
| LUV | Double Bottom, Adam and Adam | 03/15/2023 | 03/24/2023 | Air Transport | |
| SUM | Double Bottom, Eve and Adam | 03/16/2023 | 03/24/2023 | Cement and Aggregates | |
| SRDX | Pipe bottom | 03/13/2023 | 03/20/2023 | Medical Supplies | |
| TPR | Double Bottom, Adam and Adam | 03/13/2023 | 03/27/2023 | Apparel | |
| TRGP | Double Bottom, Adam and Adam | 03/16/2023 | 03/24/2023 | Natural Gas (Diversified) | |
| TDOC | Triangle, symmetrical | 03/20/2023 | 03/30/2023 | Healthcare Information | |
| TKR | Double Bottom, Adam and Adam | 03/17/2023 | 03/24/2023 | Metal Fabricating | |
| TOL | Triangle, symmetrical | 02/21/2023 | 03/30/2023 | Homebuilding | |
| TDG | Double Bottom, Eve and Adam | 03/15/2023 | 03/24/2023 | Aerospace/Defense | |
| RIG | Pipe bottom | 03/13/2023 | 03/20/2023 | Oilfield Svcs/Equipment | |
| VFC | Double Bottom, Adam and Adam | 03/15/2023 | 03/24/2023 | Apparel | |
| VMC | Double Bottom, Eve and Adam | 03/15/2023 | 03/24/2023 | Cement and Aggregates | |
| WLK | Pipe bottom | 03/13/2023 | 03/20/2023 | Chemical (Basic) | |
| WWD | Double Bottom, Adam and Adam | 03/17/2023 | 03/24/2023 | Precision Instrument |
![]()
Since I post this the night before, check how the futures are trading before market open. Large moves can affect the opening direction.
$ $ $
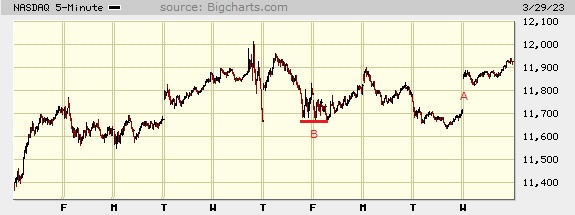
I show a picture of the Nasdaq composite on the 5-minute scale.
There's not much going on in this picture, so I had to do some hunting. At B, it's hard to see but there's a triple bottom.
It confirms as a valid pattern when price closes above the highest peak between the three bottoms. The rise after the breakout almost hit its target.
At A is a gap. Lots of people put faith in gaps, that they will support price. In my tests, they were the worst "supporting" patterns (versus peaks and valleys and round numbers). As support in an uptrend, they work 20% of the time.
The chart shows the recent peak nearing the Wed/Thursday peaks, so that's overhead resistance.
$ $ $
Here's a symbol list of 247 chart and candlestick patterns (13 "investment grade" candle patterns) found in today's securities using my version of Patternz: ABT, ADBE, AEIS, AMD, AFL, APD, ALK, ALB, ALGT, AMZN, AXP, AFG, AMWD, APH, AON, APA, APOG, AAPL, AMAT, ATR, ACGL, ANET, ARW, ASH, AIZ, AVNT, AVA, AXS, AZTA, BALL, BECN, BIG, BKNG, BSX, BCO, BR, BBW, CBT, CX, CENX, CRL, CINF, CTAS, CSCO, CNA, CNO, CTSH, CMCO, CONN, CXW, GLW, CCRN, CCK, CSGS, CMI, DVN, FANG, DOV, EXP, EMN, WIRE, EOG, RE, XOM, FICO, FAST, FLS, FORM, FTV, FCX, FDP, FRD, IT, GFS, GL, GMS, GS, GPRO, GGG, GFF, GES, THG, HLIT, HSC, HIG, HQY, HOV, HWM, HURC, ITW, ILMN, INFN, IBP, IIIN, ITGR, IBKR, TILE, INTU, JKHY, JBLU, KALU, KMT, KMB, LMT, L, LPLA, MHO, MGY, MAN, MRO, MLM, MRCY, MU, MSFT, MOS, MUR, ^IXIC, NJR, NWL, NOC, ORI, OLN, OMCL, PKG, PDCO, PEN, PXD, PPG, PFG, PGR, RRC, RJF, REGN, RGS, RGA, RES, ^GSPC, CRM, SBH, SLB, SMG, SEIC, SHW, SHOP, STR, SKYW, SCCO, LUV, SXI, SSYS, SRDX, TRGP, TGT, TDY, TPX, TXT, TDG, SLCA, UIS, UNM, VLO, VRSN, VC, VMC, WLK, WEX, ITA, FTEC, FDN, QTEC, FXL, BOTZ, QQQ, IAT, IGV, IGE, IEO, EWA, EWO, EWK, EWC, ECH, EWQ, EWG, EWH, EIS, EWI, EWJ, EWW, EPP, EWP, EWL, TUR, EWU, QLD, IBB, PEJ, ROBO, IEV, IXC, IXN, SSO, MXI, XLE, XLI, XLB, SPY, XAR, XLK, USO, VIS, VAW, MGK. Click this link for details (pattern type, start and end dates).
For a list of small patterns (those a few days wide) click this link.
$ $ $
The following table shows where Fibonacci retrace values of the day's high-low range are plus pivot points, calculated on the Nasdaq composite, sorted by value. When several are near each other (small differences), the area might act as support or resistance.
-- Thomas Bulkowski
![]()
| © 2023 ThePatternSite.com Metric | Value | Diff | Close (within 10% of the high-low range for the day)? |
| Monthly S2 | 10,609.82 | ||
| Monthly S1 | 11,268.03 | 658.21 | |
| Weekly S2 | 11,367.01 | 98.98 | |
| Monthly Pivot | 11,641.01 | 274.00 | |
| Weekly S1 | 11,646.62 | 5.61 | Yes! The Weekly S1 is close to the Monthly Pivot. |
| Daily S2 | 11,778.81 | 132.19 | |
| Low | 11,823.35 | 44.54 | |
| Weekly Pivot | 11,830.31 | 6.96 | Yes! The Weekly Pivot is close to the Low. |
| Daily S1 | 11,852.53 | 22.22 | |
| Open | 11,855.59 | 3.06 | Yes! The Open is close to the Daily S1. |
| 61.8% Down from Intraday High | 11,868.52 | 12.93 | |
| 50% Down from Intraday High | 11,882.47 | 13.95 | |
| 38.2% Down from Intraday High | 11,896.43 | 13.95 | |
| Daily Pivot | 11,897.06 | 0.63 | Yes! The Daily Pivot is close to the 38.2% Down from Intraday High. |
| Close | 11,926.24 | 29.18 | |
| High | 11,941.60 | 15.36 | |
| Daily R1 | 11,970.78 | 29.18 | |
| Daily R2 | 12,015.31 | 44.54 | |
| Weekly R1 | 12,109.92 | 94.61 | |
| Weekly R2 | 12,293.61 | 183.68 | |
| Monthly R1 | 12,299.22 | 5.61 | Yes! The Monthly R1 is close to the Weekly R2. |
| Monthly R2 | 12,672.20 | 372.98 |
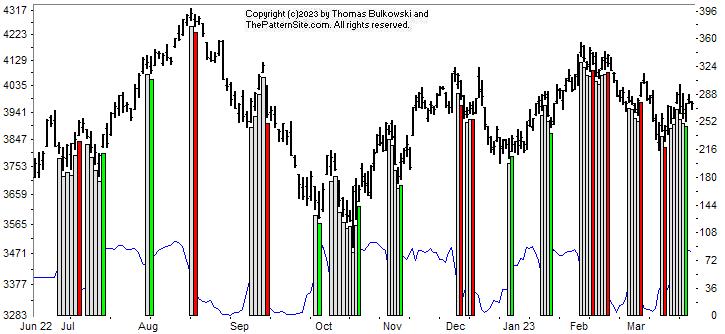
This is a picture of the chart pattern indicator on the daily scale. The indicator is the line chart below a chart of the S&P 500 composite.
Three trading days ago, the CPI signaled a bullish turn. Today, the index appears to be retracing that strong push upward. I'm concerned that the index could continue lower.
Until the signal changes (and it could if the market makes a big move), the chart is bullish but it seems to be getting weaker. Indeed, it has been trending lower from the February peak.
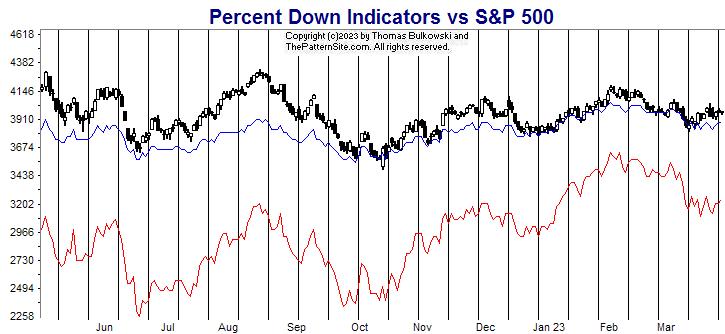
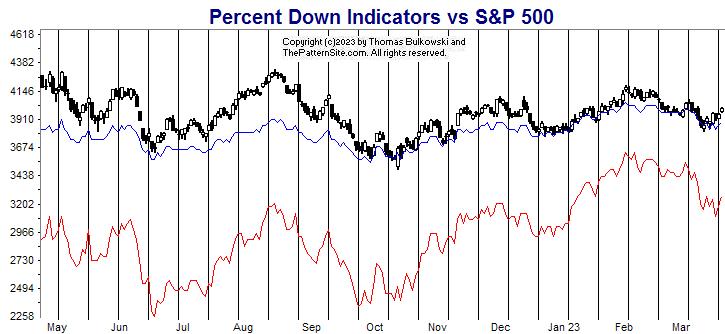
The red line is the percentage of stocks at least 20% below their 1-year high (plotted upside down). The blue line is the average percentage drop of stocks below their 1-year high (plotted upside down).
On Tuesday, 46% of stocks in my database are in bear market territory (down at least 20% from their 1-year high).A week ago, it was 45%.The fewest was 32% on 02/02/2023.And the most was 81% on 06/17/2022.
The 520 stocks in my database are down an average of 23% from their yearly high.A week ago, the average was 22%.The peak was 17% on 02/02/2023.And the bottom was 34% on 09/30/2022.
The red line is easiest to see. It's slightly weaker today compared to a week ago. The line is moving sideways, struggling to find direction.
This chart is probably neutral, meaning that the red line could soar as easily as it could plummet.
Taken together, the market seems to be in a state of change, as if it's waiting for something to happen (such as a surprise FED meeting to change interest rates). A large move in either direction could start a new trend.
$ $ $
Here's a symbol list of 152 chart and candlestick patterns (13 "investment grade" candle patterns) found in today's securities using my version of Patternz: AEIS, ALB, AEE, AFG, APH, APA, APOG, ARCB, ACGL, ANET, AIZ, AGO, AVNT, AXS, BCPC, BERY, BKH, BFH, BCO, CBT, CALM, CLS, CX, CNC, CNP, CINF, CNA, CNO, CMTL, COTY, CCRN, XRAY, D, DOV, DUK, EMN, EOG, EQT, RE, XOM, FICO, FISV, FLS, FORM, IT, GPN, GL, GMS, GS, GPRO, GFF, HIG, HQY, HSY, HOV, HWM, HURC, INCY, IBP, IIIN, PODD, IBKR, TILE, INTU, KALU, KEYS, KLIC, LANC, LEN, LPLA, MGY, MRO, MCHX, MLM, MRCY, META, MU, MUR, NEU, NOC, ORI, OLN, OMC, OTEX, OMI, PATK, PEN, PFE, PNW, PXD, POR, PFG, PGR, PEG, KWR, QCOM, RRC, RJF, RGS, RGA, ROL, ROST, RES, CRM, SBH, SCHW, SCI, SHW, STR, SKYW, SCCO, SCS, SUM, SRDX, TRGP, TPX, SLCA, UIS, UNM, VFC, VMI, WLK, WOLF, FTEC, FDN, QQQ, IAT, IEO, IYF, ECH, EWI, EWM, EWW, EWS, EWY, TUR, QLD, ILF, XLE, XLK, XLU, UNG, USO. Click this link for details (pattern type, start and end dates).
For a list of small patterns (those a few days wide) click this link.
-- Thomas Bulkowski
![]()
$ $ $
I show another slider trading quiz featuring Wyeth: WYE stock.
$ $ $
I released another version of Patternz version 7.0.0.55. This supports two more quote providers (one of which you'll have to include the exchange you want quotes from, such as AAPL.US for apple computer in the US) and includes a SR (support/resistance) button on the chart form. Click it on/off to show or hide the lines. I'm nearing the end of my tweaks. I don't plan on adding any new features from here, but need to look at some graphics issues with cryptocurrencies.
$ $ $
Here's a symbol list of 139 chart and candlestick patterns (13 "investment grade" candle patterns) found in today's securities using my version of Patternz: DDD, ABM, ACIW, AEIS, AES, AFL, ALKS, AMZN, AMN, APH, AR, ATR, ANET, AVNT, AVA, AZTA, BMI, BSET, BAX, BBBY, BBY, BAH, BRC, BMY, BR, CBT, CPB, CE, CLS, CIEN, CTAS, CLX, CNX, CSGP, COTY, DDS, EMN, EFX, EXC, FFIV, FAST, FORM, FDP, GGG, HE, HSY, HNI, HOLX, HD, DHI, ITW, INFN, IIIN, ITGR, IPG, INTU, KBH, KMT, KEYS, LH, LANC, LEG, LEN, L, LPLA, MANH, MCHX, MAS, MDC, MGEE, MU, NFG, NWL, NXGN, NKE, NWPX, OGE, ORI, OLN, OMCL, OXM, PKE, PEN, PRFT, PKI, PCG, POR, PPG, PPL, QCOM, RMBS, RGA, RHI, ROG, ROL, SAIC, SIGI, NOW, SKYW, SMAR, SR, SPSC, SCS, SUM, SRDX, TDOC, TFX, UNH, VECO, VEEV, MDRX, V, WMT, WLK, WMB, WOLF, WWD, WDAY, ITA, IYM, IYK, IHE, IDU, FTEC, FDN, QQQ, IHI, ECH, EWJ, QLD, PPA, PBE, PJP, XLB, XAR, XLK, UNG, VAW. Click this link for details (pattern type, start and end dates).
For a list of small patterns (those a few days wide) click this link.
$ $ $
The following table shows where Fibonacci retrace values of the day's high-low range are plus pivot points, calculated on the Dow industrials, sorted by value. When several are near each other (small differences), the area might act as support or resistance.
-- Thomas Bulkowski
![]()
| © 2023 ThePatternSite.com Metric | Value | Diff | Close (within 10% of the high-low range for the day)? |
| Monthly S2 | 30,250.66 | ||
| Monthly S1 | 31,341.37 | 1,090.71 | |
| Weekly S2 | 31,376.34 | 34.97 | |
| Weekly S1 | 31,904.21 | 527.87 | |
| Daily S2 | 32,136.99 | 232.78 | |
| Low | 32,276.72 | 139.73 | |
| Open | 32,276.72 | 0.00 | Yes! The Open is close to the Low. |
| Daily S1 | 32,284.53 | 7.81 | Yes! The Daily S1 is close to the Open. |
| Weekly Pivot | 32,333.05 | 48.52 | |
| 61.8% Down from Intraday High | 32,386.46 | 53.41 | |
| 50% Down from Intraday High | 32,420.36 | 33.90 | |
| Daily Pivot | 32,424.27 | 3.91 | Yes! The Daily Pivot is close to the 50% Down from Intraday High. |
| Close | 32,432.08 | 7.81 | Yes! The Close is close to the Daily Pivot. |
| 38.2% Down from Intraday High | 32,454.26 | 22.18 | Yes! The 38.2% Down from Intraday High is close to the Close. |
| Monthly Pivot | 32,520.53 | 66.27 | |
| High | 32,564.00 | 43.47 | |
| Daily R1 | 32,571.81 | 7.81 | Yes! The Daily R1 is close to the High. |
| Daily R2 | 32,711.55 | 139.73 | |
| Weekly R1 | 32,860.92 | 149.38 | |
| Weekly R2 | 33,289.76 | 428.84 | |
| Monthly R1 | 33,611.24 | 321.48 | |
| Monthly R2 | 34,790.40 | 1,179.16 |
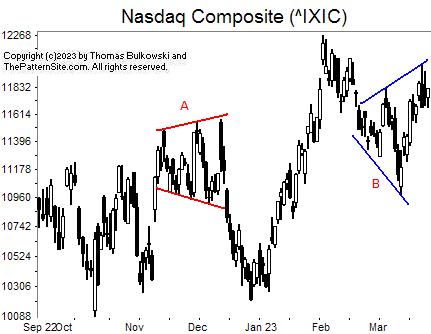
I show the Nasdaq composite on the daily scale.
At A is a chart pattern called a broadening top. That's where the price swings widen over time, forming what looks like a megaphone.
B shows a similar pattern, called a broadening bottom. It's the same as the top version except for the direction price enters the pattern.
Broadening bottoms (B) breakout upward 60% of the time, according to my research of the chart pattern. That's not much above random, but that's what I found when studying over 1,000 of them.
![]()
The following is a brief review of how the markets performed over time. The numbers refer to the close-to-close move in the Dow industrials.
No options expire this week.
![]()
The following is based on an SFO article in December 2004 by John Seekinger, titled, "Take a two-dimensional approach." He offers these tips.
| Index | S2 | S1 | Pivot | R1 | R2 |
| Dow Industrials (^DJI): Daily | 31,648 | 31,943 | 32,100 | 32,395 | 32,552 |
| Weekly | 31,311 | 31,775 | 32,268 | 32,731 | 33,225 |
| Monthly | 30,186 | 31,212 | 32,456 | 33,482 | 34,726 |
| S&P500 (^GSPC): Daily | 3,887 | 3,929 | 3,951 | 3,993 | 4,015 |
| Weekly | 3,843 | 3,907 | 3,973 | 4,037 | 4,104 |
| Monthly | 3,683 | 3,827 | 3,953 | 4,097 | 4,222 |
| Nasdaq (^IXIC): Daily | 11,618 | 11,721 | 11,774 | 11,877 | 11,929 |
| Weekly | 11,333 | 11,578 | 11,796 | 12,042 | 12,260 |
| Monthly | 10,576 | 11,200 | 11,607 | 12,231 | 12,638 |
Here are the formulas:
![]()
Earnings season is over.
Here's a symbol list of 97 chart and candlestick patterns (13 "investment grade" candle patterns) found in today's securities using my version of Patternz: ACIW, AYI, ABC, APA, ASH, AZTA, BALL, BECN, BKH, BSX, CPB, CLF, CLX, CAG, COST, COTY, CR, CW, FTV, HE, HL, HSIC, HOLX, DHI, IDA, IEX, ILMN, IIIN, IPI, ISRG, JAZZ, LHX, LNC, LPLA, LXU, MANH, MTRX, MDC, MGEE, MSFT, MCO, MS, ^IXIC, NEWR, NOVT, OMCL, OXM, PYPL, PEN, PRFT, PKI, PINC, KWR, QCOM, RMBS, RRC, ^GSPC, SLB, NOW, SKX, SMAR, SWN, SCS, TDOC, TDY, TFX, TMO, RIG, WAT, WOLF, WDAY, IAI, IYK, IHE, IDU, DDM, FDN, QQQ, IYH, IYZ, IHI, EWO, EWW, EWT, QLD, DBA, PHO, SSO, XLV, SPY, USO, VHT, MGK. Click this link for details (pattern type, start and end dates).
For a list of small patterns (those a few days wide) click this link.
The below industries were the best (rank 1) or worst performing of those I follow.
|
-- Thomas Bulkowski
![]()
$ $ $
Here's a symbol list of 129 chart and candlestick patterns (13 "investment grade" candle patterns) found in today's securities using my version of Patternz: ANF, ACIW, AFL, ATSG, ALK, ALB, AEL, ABC, BECN, BERY, BKH, BAH, BCO, CNC, CF, CVX, CI, CLF, CLX, CNA, CAG, GLW, COTY, CRH, DVN, FANG, DSGR, BOOM, ELV, EOG, EVRG, EZPW, FDS, FDX, FCX, GMS, GFF, HL, HSII, HON, IPI, NVTA, KALU, KBH, LH, LAMR, LDOS, LLY, LNC, RAMP, LXU, MANH, MRO, MTDR, MTRX, MDC, MDT, MLKN, MOS, MUR, MYGN, NBR, NFLX, OXY, OMCL, OXM, PATK, PEN, PXD, PPL, QCOM, RMBS, RJF, REGN, ROL, ROST, R, SLB, SAIC, NOW, STR, SMAR, SCS, TDOC, TFX, TPX, TJX, TDG, TZOO, TWLO, SLCA, UNH, MDRX, WERN, WSM, WDAY, IYE, IEZ, IHE, FDN, FXI, IYH, IHF, IYZ, IGE, IEO, IYF, IHI, EWK, EZA, THD, EWU, PBE, PEJ, PXJ, IXC, IXN, XLY, XLE, XLF, XRT, XAR, USO, VHT, VIS. Click this link for details (pattern type, start and end dates).
For a list of small patterns (those a few days wide) click this link.
$ $ $
You can find setups based on a Fibonacci retrace by clicking on the link.
The following patterns were found manually, not using Patternz. Mr. Bulkowski has excluded any securities he owns from appearing in the list. However, he may add any of the securities listed to his portfolio at any time, just as you can.
In the table below, the red and green colors are based on the historical breakout direction for the associated chart pattern. If a high and tight flag appears, the start and end dates highlight the flagpole only and not the flag.
For details about the chart patterns, click here.
-- Thomas Bulkowski
![]()
| Symbol | Chart Pattern | Bullish Bearish | Start | End | Industry |
| DOX | Scallop, descending | 02/15/2023 | 03/21/2023 | IT Services | |
| BAH | Scallop, descending | 03/06/2023 | 03/21/2023 | IT Services | |
| CX | Pipe top | 02/27/2023 | 03/06/2023 | Cement and Aggregates | |
| CHKP | Triple bottom | 02/17/2023 | 03/13/2023 | E-Commerce | |
| CHS | Double Top, Eve and Adam | 03/03/2023 | 03/16/2023 | Apparel | |
| GFS | Triple bottom | 02/23/2023 | 03/13/2023 | Semiconductor | |
| GOOGL | Double Bottom, Adam and Eve | 02/24/2023 | 03/13/2023 | Internet | |
| IIIN | Triangle, symmetrical | 01/17/2023 | 03/06/2023 | Building Materials | |
| PODD | Triple bottom | 02/22/2023 | 03/10/2023 | Medical Supplies | |
| LMT | Double Top, Adam and Eve | 02/13/2023 | 03/08/2023 | Aerospace/Defense | |
| MAS | Double Top, Adam and Eve | 02/02/2023 | 02/09/2023 | Building Materials | |
| NEU | Double Bottom, Adam and Eve | 02/24/2023 | 03/15/2023 | Chemical (Specialty) | |
| PEN | Pipe bottom | 03/06/2023 | 03/13/2023 | Medical Supplies | |
| PHM | Double Bottom, Eve and Adam | 02/21/2023 | 03/13/2023 | Homebuilding | |
| REGN | Ugly double bottom | 01/09/2023 | 02/17/2023 | Biotechnology | |
| SMAR | Pipe bottom | 03/06/2023 | 03/13/2023 | E-Commerce | |
| SNPS | Double Bottom, Eve and Adam | 02/21/2023 | 03/13/2023 | Computer Software and Svcs | |
| TFX | Pipe bottom | 03/06/2023 | 03/13/2023 | Diversified Co. | |
| VRTX | Double Bottom, Eve and Eve | 02/27/2023 | 03/08/2023 | Biotechnology | |
| SOXX | Triple bottom | 02/22/2023 | 03/13/2023 | Semiconductor | |
| MGK | Diamond bottom | 02/27/2023 | 03/15/2023 | None |
![]()
Since I post this the night before, check how the futures are trading before market open. Large moves can affect the opening direction.
$ $ $
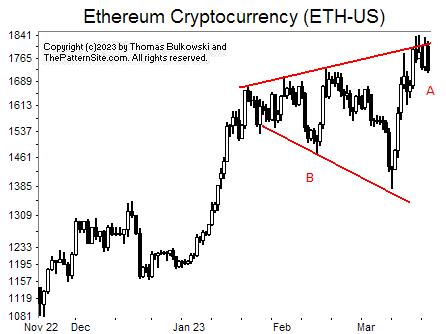
I show a picture of cryptocurrency Ethereum on the daily scale.
This is almost a picture perfect image of a broadening top chart pattern. It appears as price trends upward into the start of the pattern.
From there, it makes higher swings upward and lower swings downward, looking like a megaphone, B.
At A, the currency has paused. This could be a partial decline. That's when price attempts to reach the bottom line, doesn't make it, and breaks out upward immediately. The signal is correct 72% of the time.
Is that what will happen this time (an upward breakout)? Answer: I don't know. The probabilities were for stocks, not cryptocurrencies.
$ $ $
My neighbor backed into his neighbors mailbox, looked at it, and walked back to his pickup, parked it, and started washing his car as if nothing had happened.
He didn't leave a note, so I sent him an email to do the right thing and tell of the accident. Will it work?
$ $ $
Here's a symbol list of 202 chart and candlestick patterns (13 "investment grade" candle patterns) found in today's securities using my version of Patternz: ABT, ACIW, ADBE, ADTN, AMD, AFL, ATSG, ALK, ALB, AA, AXP, ABC, AON, ACGL, AWI, ATO, ADP, AVA, AXS, BBBY, BAH, BG, CACI, CNC, CDAY, CF, CVX, CI, CLF, CLX, CNA, CAG, CONN, GLW, COTY, CRH, CROX, CCK, DHR, DVN, FANG, ^DJI, EIX, ELV, EOG, EFX, EVRG, EXPI, FDS, FDX, FE, FORM, FCX, GME, GD, GE, GMS, GFF, HQY, HL, HSII, HNI, HON, IDA, IDXX, ILMN, IBKR, IPG, NVTA, K, KBAL, KLAC, LZB, LH, LRCX, LDOS, RAMP, MANH, MRO, MA, MTDR, MTRX, MDC, MDT, MRCY, MGEE, MOS, MUR, NBR, NJR, NEE, NI, JWN, NWPX, OXY, OMCL, ON, OTEX, OXM, PATK, PAYX, PEN, PNW, PXD, POR, QCOM, RMBS, RJF, ROL, ROST, R, SLB, SAIC, SMG, SMTC, NOW, STR, SMAR, LUV, SR, SPSC, SXI, SCS, TDOC, TFX, TPX, TMO, TJX, TDG, TZOO, TWLO, UNH, VECO, VRTX, V, WSM, WWW, WDAY, XEL, IYC, IYE, IEZ, IDU, FDN, QTEC, FXL, BOTZ, IYH, IHF, IYZ, IGV, SLV, IGE, IEO, IYF, IHI, EWK, EEM, EWQ, EWG, EIS, EWI, EWS, EWL, EWT, EWU, QLD, PPA, PEJ, PXJ, IXC, IXN, ILF, XLY, XLE, XLF, XLV, XRT, XAR, XLK, XLU, VHT, VIS. Click this link for details (pattern type, start and end dates).
For a list of small patterns (those a few days wide) click this link.
$ $ $
The following table shows where Fibonacci retrace values of the day's high-low range are plus pivot points, calculated on the Nasdaq composite, sorted by value. When several are near each other (small differences), the area might act as support or resistance.
-- Thomas Bulkowski
![]()
| © 2023 ThePatternSite.com Metric | Value | Diff | Close (within 10% of the high-low range for the day)? |
| Monthly S2 | 10,486.19 | ||
| Weekly S2 | 10,684.98 | 198.79 | |
| Monthly S1 | 11,078.08 | 393.10 | |
| Weekly S1 | 11,177.47 | 99.39 | |
| Daily S2 | 11,436.46 | 258.99 | |
| Weekly Pivot | 11,475.29 | 38.83 | |
| Daily S1 | 11,553.21 | 77.92 | |
| Monthly Pivot | 11,574.68 | 21.47 | Yes! The Monthly Pivot is close to the Daily S1. |
| Low | 11,666.85 | 92.17 | |
| Close | 11,669.96 | 3.11 | Yes! The Close is close to the Low. |
| Daily Pivot | 11,783.60 | 113.64 | |
| 61.8% Down from Intraday High | 11,799.46 | 15.86 | Yes! The 61.8% Down from Intraday High is close to the Daily Pivot. |
| 50% Down from Intraday High | 11,840.42 | 40.96 | |
| Open | 11,857.50 | 17.08 | Yes! The Open is close to the 50% Down from Intraday High. |
| 38.2% Down from Intraday High | 11,881.38 | 23.88 | Yes! The 38.2% Down from Intraday High is close to the Open. |
| Daily R1 | 11,900.35 | 18.97 | Yes! The Daily R1 is close to the 38.2% Down from Intraday High. |
| Weekly R1 | 11,967.78 | 67.43 | |
| High | 12,013.99 | 46.21 | |
| Daily R2 | 12,130.74 | 116.75 | |
| Monthly R1 | 12,166.57 | 35.83 | |
| Weekly R2 | 12,265.60 | 99.03 | |
| Monthly R2 | 12,663.17 | 397.57 |
This is a picture of the chart pattern indicator on the daily scale. The indicator is the line chart below a chart of the S&P 500 composite.
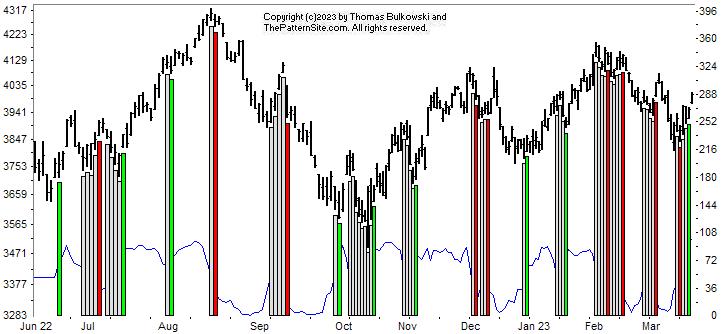
The CPI has signaled a bullish move has begun. The vertical green bar on the far right of the chart attests to that. It comes after a long downtrend that began in February. That move bottomed in March.
Because the indicator can change its mind for up to a week, it's too soon to declare the uptrend has staying power, but it looks promising.
The red line is the percentage of stocks at least 20% below their 1-year high (plotted upside down). The blue line is the average percentage drop of stocks below their 1-year high (plotted upside down).
On Tuesday, 45% of stocks in my database are in bear market territory (down at least 20% from their 1-year high).A week ago, it was 45%.The fewest was 32% on 02/02/2023.And the most was 81% on 06/17/2022.
The 520 stocks in my database are down an average of 22% from their yearly high.A week ago, the average was 23%.The peak was 17% on 02/02/2023.And the bottom was 34% on 09/30/2022.
The red line is unchanged from a week ago but the blue line is slightly stronger. Like the prior chart, this chart shows that weakness began at the late January or early February peak.
What does all of this mean? The prior chart is bullish but it could be a premature signal. This chart is neutral, really. So it's difficult to say we'll recover from here, but that's my guess.
$ $ $
Here's a symbol list of 139 chart and candlestick patterns (13 "investment grade" candle patterns) found in today's securities using my version of Patternz: ACIW, AYI, AMD, AJRD, ATSG, DOX, ABC, ACGL, ATO, AVA, BSET, BBY, BIO, BKH, CLS, CDAY, CVX, CLX, CMTL, CSGP, CRH, CROX, DHR, DVN, FANG, DTE, EIX, EFX, EXC, EXPI, XOM, FFIV, FDS, FICO, FE, FISV, FMC, FORM, FCX, HLIT, HOV, IDA, IDXX, INCY, ISRG, NVTA, KEYS, KLAC, LRCX, RAMP, MANH, MTRX, MDC, MDT, MGEE, MLKN, NTAP, NJR, NEE, NKE, NI, OMCL, OXM, PANW, PKE, PEN, PNW, POR, PPL, PEG, QCOM, RMBS, RGS, SMG, NOW, SKYW, SMAR, SWN, SR, SPSC, TPR, TRGP, TDOC, TFX, TEVA, TWLO, VLO, VMI, VECO, WDAY, XEL, IYM, IYE, IDU, FDN, BOTZ, QQQ, IHF, SOXX, SLV, IEO, IHI, EWO, ECH, EWQ, EWG, EIS, EWI, EWM, EWS, EWY, EWP, EWD, EWL, EWT, TUR, EWU, QLD, PEJ, PXJ, IEV, XLY, XLU, UNG, MGK. Click this link for details (pattern type, start and end dates).
For a list of small patterns (those a few days wide) click this link.
-- Thomas Bulkowski
![]()
$ $ $
I show another slider trading quiz featuring Xcel Energy: XEL stock.
$ $ $
Here's a symbol list of 101 chart and candlestick patterns (13 "investment grade" candle patterns) found in today's securities using my version of Patternz: DDD, ATSG, AA, ALL, ABC, APOG, ATR, AIZ, BMI, BBBY, BERY, BKNG, BOOT, BRC, BBW, BLDR, CBT, CALM, CX, CENX, CF, CHKP, CLNE, CLF, CNA, CXW, CW, DFS, ^DJI, DRQ, EXP, EXC, FDP, IT, HAYN, HL, HSII, HP, HNI, HOV, IDA, NSP, IBP, PODD, IBKR, IPI, IRM, KBAL, KSS, LH, LLY, M, MGY, MAN, MTRN, MTRX, MLKN, MOS, PKG, PEN, PSTG, RGS, RLI, RES, SLGN, SXI, SSYS, SRDX, TPR, RIG, TWLO, SLCA, UNM, WERN, IYM, IYK, IYE, IEZ, IHE, IHF, IGE, EIS, EWJ, EWS, TUR, PBE, PXJ, IXN, XLP, XLE, XLB, UNG, VAW. Click this link for details (pattern type, start and end dates).
For a list of small patterns (those a few days wide) click this link.
$ $ $
The following table shows where Fibonacci retrace values of the day's high-low range are plus pivot points, calculated on the Dow industrials, sorted by value. When several are near each other (small differences), the area might act as support or resistance.
-- Thomas Bulkowski
![]()
| © 2023 ThePatternSite.com Metric | Value | Diff | Close (within 10% of the high-low range for the day)? |
| Monthly S2 | 29,766.97 | ||
| Monthly S1 | 31,005.78 | 1,238.80 | |
| Weekly S2 | 31,116.89 | 111.12 | |
| Weekly S1 | 31,680.74 | 563.84 | |
| Daily S2 | 31,724.59 | 43.85 | |
| Low | 31,872.33 | 147.74 | |
| Open | 31,872.33 | 0.00 | Yes! The Open is close to the Low. |
| Daily S1 | 31,984.58 | 112.25 | |
| Weekly Pivot | 31,993.66 | 9.08 | Yes! The Weekly Pivot is close to the Daily S1. |
| 61.8% Down from Intraday High | 32,028.09 | 34.42 | Yes! The 61.8% Down from Intraday High is close to the Weekly Pivot. |
| 50% Down from Intraday High | 32,076.20 | 48.11 | |
| 38.2% Down from Intraday High | 32,124.31 | 48.11 | |
| Daily Pivot | 32,132.33 | 8.01 | Yes! The Daily Pivot is close to the 38.2% Down from Intraday High. |
| Close | 32,244.58 | 112.25 | |
| High | 32,280.07 | 35.49 | Yes! The High is close to the Close. |
| Daily R1 | 32,392.32 | 112.25 | |
| Daily R2 | 32,540.07 | 147.74 | |
| Weekly R1 | 32,557.51 | 17.44 | Yes! The Weekly R1 is close to the Daily R2. |
| Monthly Pivot | 32,668.62 | 111.12 | |
| Weekly R2 | 32,870.43 | 201.81 | |
| Monthly R1 | 33,907.43 | 1,036.99 | |
| Monthly R2 | 35,570.27 | 1,662.85 |
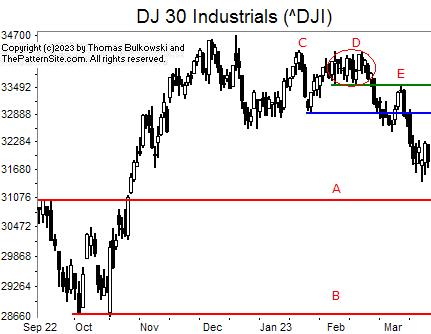
I show the Dow industrials on the daily scale.
I don't show enough of the chart but it looks to me like the index could drop as far as B (where the uptrend began) to A (a minor high). That AB region could support price.
CD is a double top, confirmed when the index closes below the blue line, which is the lowest low between the two peaks.
Notice at D, a thick top, resists the pullback E, from going higher.
The drop from D to E to where it is now, is a pattern called a measured move down. That pattern suggests price will rise up to the retrace (the corrective phase of the MMD) which ends at E. That's about 32,900.
![]()
The following is a brief review of how the markets performed over time. The numbers refer to the close-to-close move in the Dow industrials.
No options expire this week.
![]()
The following is based on an SFO article in December 2004 by John Seekinger, titled, "Take a two-dimensional approach." He offers these tips.
| Index | S2 | S1 | Pivot | R1 | R2 |
| Dow Industrials (^DJI): Daily | 31,447 | 31,655 | 31,936 | 32,143 | 32,425 |
| Weekly | 30,989 | 31,426 | 31,866 | 32,302 | 32,743 |
| Monthly | 29,639 | 30,751 | 32,541 | 33,652 | 35,443 |
| S&P500 (^GSPC): Daily | 3,868 | 3,892 | 3,926 | 3,950 | 3,983 |
| Weekly | 3,741 | 3,829 | 3,897 | 3,984 | 4,052 |
| Monthly | 3,611 | 3,764 | 3,962 | 4,115 | 4,313 |
| Nasdaq (^IXIC): Daily | 11,445 | 11,538 | 11,655 | 11,748 | 11,866 |
| Weekly | 10,672 | 11,151 | 11,462 | 11,941 | 12,252 |
| Monthly | 10,473 | 11,052 | 11,562 | 12,140 | 12,650 |
Here are the formulas:
![]()
Earnings season is over.
Here's a symbol list of 100 chart and candlestick patterns (13 "investment grade" candle patterns) found in today's securities using my version of Patternz: ACIW, AMD, A, APD, AA, ATR, ANET, AVY, BMI, BSET, BAX, BBBY, BKNG, BMY, BR, BRKR, BLDR, CALM, CX, CNC, CNP, CENX, CDAY, CIEN, CLF, DSGR, DRQ, EXP, EL, EZPW, FDX, FDP, FRD, HAYN, HSII, HP, HSY, HOLX, HOV, HUBG, IBP, ITGR, IPI, IRM, JNJ, LH, LDOS, LNC, LMT, LOW, M, MGY, MAS, MTRN, MTRX, MRCY, MSFT, MOS, NFLX, JWN, NVDA, ORI, PCTY, PKI, DGX, RRC, RGS, RLI, ROL, ROP, RES, SMTC, SXI, TECH, TPX, RIG, TG, TWLO, SLCA, WERN, WSM, WOLF, IYM, IEZ, IYH, THD, PXJ, GLD, UNG. Click this link for details (pattern type, start and end dates).
For a list of small patterns (those a few days wide) click this link.
The below industries were the best (rank 1) or worst performing of those I follow.
|
-- Thomas Bulkowski
![]()
$ $ $
Here's a symbol list of 135 chart and candlestick patterns (13 "investment grade" candle patterns) found in today's securities using my version of Patternz: ACIW, AYI, AEIS, AMD, AJRD, AA, DOX, ABC, AMAT, ATR, ACGL, BMI, BCPC, BECN, BKNG, BLDR, CX, CENX, CIEN, CLF, DECK, XRAY, DSGR, DRQ, DTE, EXP, EMN, EXPD, EZPW, FAST, FTNT, FRD, GME, GFS, HAYN, HSII, HP, DHI, HOV, IEX, IDXX, INCY, IBP, PODD, IPI, KELYA, LANC, LEN, LNC, LXU, MTSI, M, MGY, MCHX, MRTN, MTRN, MTRX, MRCY, MSFT, MLKN, MOS, NBR, NFLX, NEU, NXGN, NWPX, NOVT, ASGN, ON, OTEX, OXM, PATK, PFE, PLXS, PINC, PGR, DGX, RLI, ROP, RES, SWN, SXI, SCS, SNPS, TDY, TDC, TER, TEVA, TMO, TSCO, RIG, TZOO, TG, TWLO, SLCA, UPS, UNH, VFC, VECO, VEEV, VRTX, V, WSO, WERN, IYM, IYC, ITB, IEZ, IHE, BOTZ, IHI, EWK, EWH, EIS, EWI, EWW, DBA, PBE, PXJ, PJP, ILF. Click this link for details (pattern type, start and end dates).
For a list of small patterns (those a few days wide) click this link.
$ $ $
You can find setups based on a Fibonacci retrace by clicking on the link.
The following patterns were found manually, not using Patternz. Mr. Bulkowski has excluded any securities he owns from appearing in the list. However, he may add any of the securities listed to his portfolio at any time, just as you can.
In the table below, the red and green colors are based on the historical breakout direction for the associated chart pattern. If a high and tight flag appears, the start and end dates highlight the flagpole only and not the flag.
For details about the chart patterns, click here.
-- Thomas Bulkowski
![]()
| Symbol | Chart Pattern | Bullish Bearish | Start | End | Industry |
| ADBE | Double Bottom, Eve and Adam | 02/24/2023 | 03/13/2023 | Computer Software and Svcs | |
| AA | Pipe top | 02/27/2023 | 03/06/2023 | Aerospace/Defense | |
| ALGT | Triple top | 02/02/2023 | 03/03/2023 | Air Transport | |
| AIG | Double Top, Adam and Eve | 12/13/2022 | 01/09/2023 | Insurance (Prop/Casualty) | |
| ATR | Pipe top | 02/27/2023 | 03/06/2023 | Packaging and Container | |
| AVA | Double Bottom, Adam and Adam | 03/01/2023 | 03/10/2023 | Electric Utility (West) | |
| BMI | Pipe top | 02/27/2023 | 03/06/2023 | Precision Instrument | |
| BKNG | Pipe top | 02/27/2023 | 03/06/2023 | Internet | |
| BLDR | Pipe top | 02/27/2023 | 03/06/2023 | Retail Building Supply | |
| CAL | Double Top, Adam and Adam | 02/02/2023 | 02/21/2023 | Shoe | |
| CNP | Double Bottom, Adam and Adam | 03/01/2023 | 03/10/2023 | Electric Utility (Central) | |
| CENX | Pipe top | 02/27/2023 | 03/06/2023 | Metals and Mining (Div.) | |
| CLF | Pipe top | 02/27/2023 | 03/06/2023 | Metals and Mining (Div.) | |
| COTY | Double Top, Adam and Eve | 02/14/2023 | 03/06/2023 | Toiletries/Cosmetics | |
| CCRN | Pipe top | 01/30/2023 | 02/06/2023 | Human Resources | |
| ^DJU | Double Bottom, Adam and Adam | 03/02/2023 | 03/10/2023 | None | |
| DRQ | Pipe top | 02/27/2023 | 03/06/2023 | Oilfield Svcs/Equipment | |
| DUK | Double Bottom, Adam and Adam | 03/02/2023 | 03/10/2023 | Electric Utility (East) | |
| EXP | Pipe top | 02/27/2023 | 03/06/2023 | Cement and Aggregates | |
| FISV | Double Top, Eve and Eve | 02/15/2023 | 03/06/2023 | IT Services | |
| FTV | Head-and-shoulders top | 01/17/2023 | 03/06/2023 | Industrial Services | |
| HSC | Falling wedge | 03/07/2023 | 03/16/2023 | Diversified Co. | |
| HAYN | Pipe top | 02/27/2023 | 03/06/2023 | Building Materials | |
| HELE | Head-and-shoulders complex top | 01/09/2023 | 03/07/2023 | Toiletries/Cosmetics | |
| HP | Pipe top | 02/27/2023 | 03/06/2023 | Petroleum (Producing) | |
| IEX | Double Top, Adam and Adam | 02/17/2023 | 03/06/2023 | Machinery | |
| ILMN | Triple bottom | 02/10/2023 | 03/10/2023 | Biotechnology | |
| IBP | Pipe top | 02/27/2023 | 03/06/2023 | Retail Building Supply | |
| IPI | Double Top, Eve and Eve | 02/16/2023 | 03/03/2023 | Chemical (Diversified) | |
| ISRG | Double Bottom, Adam and Adam | 03/02/2023 | 03/13/2023 | Medical Supplies | |
| KMT | Pipe top | 01/30/2023 | 02/06/2023 | Metal Fabricating | |
| LLY | Double Bottom, Eve and Eve | 03/01/2023 | 03/08/2023 | Drug | |
| L | Head-and-shoulders top | 01/31/2023 | 02/27/2023 | Insurance (Prop/Casualty) | |
| MTRN | Pipe top | 02/27/2023 | 03/06/2023 | Metals and Mining (Div.) | |
| MGEE | Triangle, descending | 01/20/2023 | 03/10/2023 | Electric Utility (Central) | |
| MCO | Diamond bottom | 02/24/2023 | 03/16/2023 | Information Services | |
| MOS | Pipe top | 02/27/2023 | 03/06/2023 | Chemical (Diversified) | |
| MUR | Three Falling Peaks | 01/27/2023 | 03/03/2023 | Petroleum (Integrated) | |
| NJR | Broadening top | 02/14/2023 | 03/16/2023 | Natural Gas (Distributor) | |
| JWN | Pipe top | 01/30/2023 | 02/06/2023 | Retail Store | |
| NOC | Head-and-shoulders top | 02/13/2023 | 03/08/2023 | Aerospace/Defense | |
| OXY | Three Falling Peaks | 01/27/2023 | 03/08/2023 | Petroleum (Producing) | |
| PNW | Head-and-shoulders complex bottom | 01/24/2023 | 03/01/2023 | Electric Utility (West) | |
| QTWO | Dead-cat bounce | 03/13/2023 | 03/13/2023 | E-Commerce | |
| RLI | Pipe top | 02/27/2023 | 03/06/2023 | Insurance (Prop/Casualty) | |
| RES | Pipe top | 02/27/2023 | 03/06/2023 | Oilfield Svcs/Equipment | |
| R | Head-and-shoulders top | 02/02/2023 | 03/01/2023 | Trucking/Transp. Leasing | |
| SCHW | Dead-cat bounce | 03/08/2023 | 03/13/2023 | Securities Brokerage | |
| SXI | Pipe top | 02/27/2023 | 03/06/2023 | Diversified Co. | |
| TDY | Ugly double bottom | 06/17/2022 | 07/14/2022 | Aerospace/Defense | |
| TER | Broadening top, right-angled and ascending | 02/22/2023 | 03/16/2023 | Semiconductor Cap Equip. | |
| TDG | Triple top | 02/09/2023 | 03/07/2023 | Aerospace/Defense | |
| RIG | Pipe top | 02/27/2023 | 03/06/2023 | Oilfield Svcs/Equipment | |
| TRV | Triple top | 01/06/2023 | 01/25/2023 | Insurance (Prop/Casualty) | |
| UHAL | Pipe top | 01/30/2023 | 02/06/2023 | Trucking/Transp. Leasing | |
| SLCA | Pipe top | 02/27/2023 | 03/06/2023 | Metals and Mining (Div.) | |
| WSO | Head-and-shoulders top | 02/03/2023 | 03/06/2023 | Retail Building Supply | |
| WERN | Pipe top | 01/30/2023 | 02/06/2023 | Trucking/Transp. Leasing | |
| WEX | Pipe top | 02/06/2023 | 02/13/2023 | Information Services | |
| WSC | Double Top, Adam and Eve | 02/22/2023 | 03/03/2023 | Industrial Services | |
| XEL | Double Bottom, Adam and Adam | 03/01/2023 | 03/10/2023 | Electric Utility (West) | |
| XLK | Double Bottom, Eve and Adam | 03/02/2023 | 03/13/2023 | IT Services |
![]()
Since I post this the night before, check how the futures are trading before market open. Large moves can affect the opening direction.
$ $ $
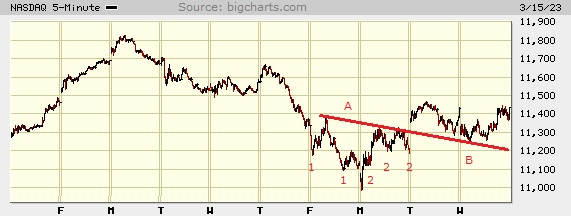
I show a picture of the Nasdaq composite on the 5-minute scale.
The 1s are left shoulders of a complex head-and-shoulders bottom. The 2s are the right shoulders. The head is the lowest low in the pattern, between 1 and 2.
Notice that there are more 2s than 1s and that's odd. It makes me suspect that this chart pattern is unreliable.
Indeed, the rise after price closed above the red neckline (A) didn't go as far up as it should have (the height of the pattern at the head to the neckline directly above added to the neckline pierce gives the typical target).
Notice that at B, the index finds support at the neckline.
The index looks to find resistance at 11,500. So it may stall there or even turn down. After a big plunge today and swift recovery, we might see the index gap open higher as a snap back recovery.
With that, I think I've covered all of the bases: down, sideways, up. 8-)
$ $ $
Here's a symbol list of 287 chart and candlestick patterns (13 "investment grade" candle patterns) found in today's securities using my version of Patternz: ACN, ACIW, AMD, AJRD, AFL, A, APD, ATSG, ALK, ALB, AA, ALGT, ALL, AEL, AXP, AFG, AIG, AME, AMGN, APH, AON, APA, ATR, ACGL, ASH, AIZ, AVNT, AXS, BMI, BERY, BMRN, BA, BKNG, BFH, BCO, BLDR, CBT, CPB, CE, CLS, CX, CENX, CF, CINF, CSCO, CLF, CNA, CNO, CTSH, CL, CMCO, CONN, COP, GLW, CCK, CMI, CW, DVN, FANG, DFS, DSGR, DOV, DRQ, BOOM, EXP, EME, EMR, WIRE, EOG, EFX, EQT, RE, EVH, EXC, EXPI, XOM, EZPW, FDX, FIS, FLS, FORM, FCX, GD, GNW, GMS, GS, GFF, GES, HSC, HIG, HAYN, HSII, HP, HON, HOV, HWM, HUM, IEX, ITW, IBP, IIIN, IBKR, TILE, IPI, KELYA, KMT, KMB, KLIC, LHX, LZB, LH, LAMR, LDOS, LNC, L, LPLA, LXU, M, MGY, MRO, MLM, MA, MTDR, MTRN, MTRX, MRCY, MSFT, MLKN, MS, MOS, MUR, NBR, NOV, NCR, NEU, NXGN, NWPX, OXY, OLN, OMC, PKG, PTEN, PXD, PLXS, PPL, PFG, PRU, QTWO, KWR, RJF, RGA, RLI, RHI, RES, SLB, STR, SKYW, SMAR, SCCO, SWN, SPLK, SXI, SCS, SSYS, SUM, TPR, TRGP, TDOC, TPX, TEVA, TXT, TKR, RIG, TRV, TZOO, TG, TWLO, SLCA, VLO, VEEV, VMC, WERN, WLK, WEX, WSC, ITA, IYM, IYK, IYE, IEZ, IHE, FXI, IYH, IGE, IEO, IYF, EWA, EWZ, EWC, ECH, EEM, EWH, EWJ, EWM, EWW, EPP, EZA, EWY, EWP, EWT, TUR, EWU, PPA, DBA, PEJ, PXJ, PHO, ROBO, IXC, ILF, MXI, XLE, XLF, XHB, XLI, XLB, XAR, UNG, USO, VIS, VAW. Click this link for details (pattern type, start and end dates).
For a list of small patterns (those a few days wide) click this link.
$ $ $
The following table shows where Fibonacci retrace values of the day's high-low range are plus pivot points, calculated on the Nasdaq composite, sorted by value. When several are near each other (small differences), the area might act as support or resistance.
-- Thomas Bulkowski
![]()
| © 2023 ThePatternSite.com Metric | Value | Diff | Close (within 10% of the high-low range for the day)? |
| Monthly S2 | 10,503.02 | ||
| Weekly S2 | 10,717.88 | 214.87 | |
| Monthly S1 | 10,968.53 | 250.65 | |
| Weekly S1 | 11,075.97 | 107.43 | |
| Daily S2 | 11,164.00 | 88.04 | |
| Low | 11,238.44 | 74.44 | |
| Open | 11,291.17 | 52.73 | |
| Daily S1 | 11,299.03 | 7.86 | Yes! The Daily S1 is close to the Open. |
| 61.8% Down from Intraday High | 11,318.45 | 19.43 | Yes! The 61.8% Down from Intraday High is close to the Daily S1. |
| 50% Down from Intraday High | 11,343.17 | 24.72 | |
| 38.2% Down from Intraday High | 11,367.89 | 24.72 | |
| Daily Pivot | 11,373.46 | 5.58 | Yes! The Daily Pivot is close to the 38.2% Down from Intraday High. |
| Close | 11,434.05 | 60.59 | |
| High | 11,447.90 | 13.85 | Yes! The High is close to the Close. |
| Weekly Pivot | 11,451.94 | 4.04 | Yes! The Weekly Pivot is close to the High. |
| Daily R1 | 11,508.49 | 56.54 | |
| Monthly Pivot | 11,559.38 | 50.89 | |
| Daily R2 | 11,582.92 | 23.55 | |
| Weekly R1 | 11,810.03 | 227.10 | |
| Monthly R1 | 12,024.89 | 214.87 | |
| Weekly R2 | 12,186.00 | 161.11 | |
| Monthly R2 | 12,615.74 | 429.73 |
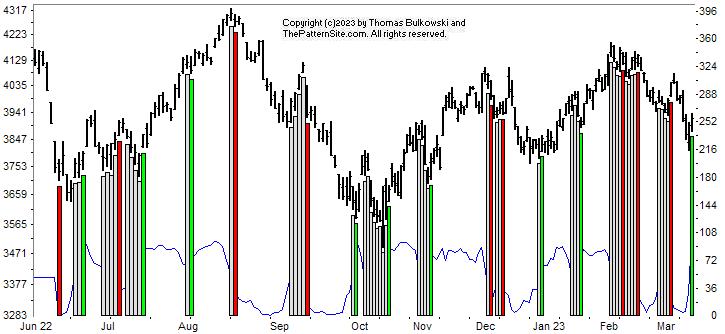
This is a picture of the chart pattern indicator on the daily scale. The indicator is the line chart below a chart of the S&P 500 composite.
After the two bank failures took the indices down Friday, they recovered and the CPI turned bullish as the green vertical bar on the far right of the chart shows.
The markets made a nice recovery today.
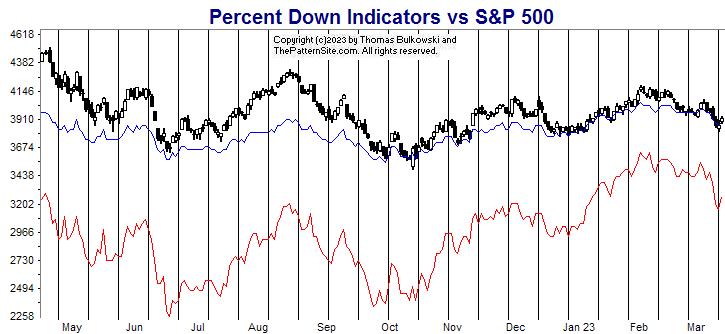
The red line is the percentage of stocks at least 20% below their 1-year high (plotted upside down). The blue line is the average percentage drop of stocks below their 1-year high (plotted upside down).
On Tuesday, 45% of stocks in my database are in bear market territory (down at least 20% from their 1-year high).A week ago, it was 40%.The fewest was 32% on 02/02/2023.And the most was 81% on 06/17/2022.
The 520 stocks in my database are down an average of 23% from their yearly high.A week ago, the average was 20%.The peak was 17% on 02/02/2023.And the bottom was 34% on 09/30/2022.
Both lines are worse today than they were a week ago. In fact, the red line took a steep dive over the last few days. Today, the red line moved higher, following the markets upward.
The CPI chart is bullish. This chart is ambiguous. I say that because the red line has made a big drop and only a slight recovery. You can argue that the CPI chart followed the same path: big drop and slight recovery.
So where does that leave us? I thought yesterday that buying something in the financial sector (like an ETF), would serve as a short-term play. Buy when quality securities are hit because of the troubles of another. I think it's too early to say whether today's snap-back rally will last.
$ $ $
Here's a symbol list of 136 chart and candlestick patterns (13 "investment grade" candle patterns) found in today's securities using my version of Patternz: ABT, AXDX, AEIS, AMD, APD, ALK, AA, AEL, AXP, AMGN, APOG, ATR, AGO, AXS, BMI, BAX, BECN, BBBY, BBY, BKNG, BAH, BFH, BLDR, BG, CX, CNP, CENX, CI, CLNE, CLF, CNO, CNX, CAG, DECK, XRAY, DRQ, BOOM, EXP, WIRE, EXPD, FISV, FDP, GIS, GNW, GL, GMS, GES, HIG, HE, HAYN, HQY, HSII, HELE, HP, HSIC, HOLX, HON, HOV, JBHT, IDA, IBP, PODD, IPI, JKHY, KSS, LANC, LNC, LMT, LPLA, LXU, M, MGY, MKTX, MRTN, MTRN, MRCY, MGEE, MSFT, MLKN, MOS, NBR, NOV, NTGR, NXGN, JWN, NOC, NUS, PKE, PEN, PPL, PINC, PRU, QTWO, RGA, RLI, ROL, RES, R, CRM, SMAR, LUV, SR, SXI, TDOC, RIG, TZOO, TWLO, UHAL, SLCA, UIS, UNH, UNM, VFC, VLO, VEEV, WRB, WMT, WERN, WEX, WDAY, IYM, IEZ, IHE, BOTZ, IYH, IEO, EWJ, EWM, EWY, THD, PXJ, XLV, VHT. Click this link for details (pattern type, start and end dates).
For a list of small patterns (those a few days wide) click this link.
-- Thomas Bulkowski
![]()
$ $ $
I show another slider trading quiz featuring an ugly bottom tutorial.
$ $ $
Here's a symbol list of 239 chart and candlestick patterns (13 "investment grade" candle patterns) found in today's securities using my version of Patternz: DDD, ANF, ACIW, AFL, ALRM, ALK, ALGT, ALL, AYX, DOX, AEO, AEL, AXP, AFG, AIG, APOG, AAPL, ARCB, ACGL, AIZ, AGO, AVNT, AXS, AZTA, BSET, BBY, BIO, BA, BOOT, BSX, BFH, BCO, BBW, BG, CAL, CPB, CLS, CX, CF, CIEN, CINF, CNA, CNO, CMCO, CMTL, CONN, COP, CRH, CCK, CSGS, CW, DVN, FANG, DFS, DRQ, BOOM, EXP, EBAY, EIX, EME, EMR, WIRE, RE, EVH, EXC, EZPW, FIS, FISV, FORM, GD, GNW, GPN, GL, GMS, GS, GES, THG, HSC, HIG, HAYN, HQY, HTLD, HL, HP, HSY, DHI, IEX, ILMN, IIIN, PODD, IBKR, TILE, JKHY, KELYA, KMT, KSS, KLIC, LRCX, LAMR, LEG, LEN, LNC, RAMP, L, LPLA, LXU, M, MAN, MRO, MRTN, MLM, MAS, MTRX, MRCY, MGEE, MSFT, MLKN, MOS, MUR, MYGN, NBR, NOV, NCR, NTAP, NWL, NEU, JWN, NWPX, ORI, OLN, OMC, ASGN, OTEX, PKG, PATK, PYPL, PLXS, PPL, PFG, PRU, QTWO, RMBS, RJF, RTX, RGA, RNG, RHI, RES, R, SBH, SLB, SCHW, SEIC, SIGI, SO, LUV, SWN, SXI, SCS, TPR, TPX, TXT, TRV, TREX, TWLO, UHAL, SLCA, UIS, UNM, VFC, V, VC, WRB, WERN, WU, WEX, ITA, IAI, IYC, IYE, ITB, IEZ, IAT, SLV, IEO, IYF, EWA, EWO, EWK, ECH, EWQ, EWG, EWH, EWI, EWM, EWW, EPP, EWS, EWP, THD, QLD, PEJ, PXJ, IXN, ILF, XLE, XLF, GLD, XHB, XLB, XRT. Click this link for details (pattern type, start and end dates).
For a list of small patterns (those a few days wide) click this link.
$ $ $
The following table shows where Fibonacci retrace values of the day's high-low range are plus pivot points, calculated on the Dow industrials, sorted by value. When several are near each other (small differences), the area might act as support or resistance.
-- Thomas Bulkowski
![]()
| © 2023 ThePatternSite.com Metric | Value | Diff | Close (within 10% of the high-low range for the day)? |
| Monthly S2 | 30,096.61 | ||
| Weekly S2 | 30,602.78 | 506.17 | |
| Monthly S1 | 30,957.88 | 355.10 | |
| Weekly S1 | 31,210.96 | 253.08 | |
| Daily S2 | 31,279.31 | 68.35 | |
| Daily S1 | 31,549.22 | 269.92 | |
| Low | 31,624.87 | 75.65 | |
| Close | 31,819.14 | 194.27 | |
| Open | 31,819.93 | 0.79 | Yes! The Open is close to the Close. |
| 61.8% Down from Intraday High | 31,859.98 | 40.05 | Yes! The 61.8% Down from Intraday High is close to the Open. |
| Daily Pivot | 31,894.79 | 34.80 | Yes! The Daily Pivot is close to the 61.8% Down from Intraday High. |
| 50% Down from Intraday High | 31,932.61 | 37.82 | Yes! The 50% Down from Intraday High is close to the Daily Pivot. |
| 38.2% Down from Intraday High | 32,005.24 | 72.63 | |
| Daily R1 | 32,164.70 | 159.47 | |
| High | 32,240.35 | 75.65 | |
| Weekly Pivot | 32,391.59 | 151.24 | |
| Daily R2 | 32,510.27 | 118.68 | |
| Monthly Pivot | 32,644.67 | 134.41 | |
| Weekly R1 | 32,999.77 | 355.10 | |
| Monthly R1 | 33,505.94 | 506.17 | |
| Weekly R2 | 34,180.40 | 674.46 | |
| Monthly R2 | 35,192.73 | 1,012.34 |
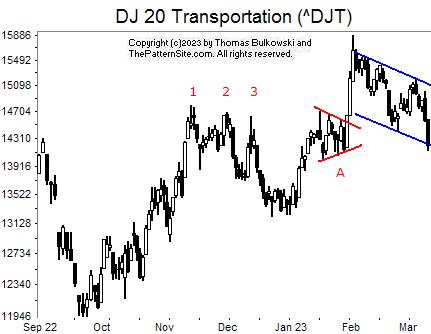
The three peaks Pattern, 1, 2, 3, is either a triple top or a three falling peaks chart pattern. It confirms as a valid chart pattern.
Pattern A is a symmetrical triangle with an upward breakout that leads to a big and strong two bar rally. From there, the index has eased lower as the blue lines attest.
It looks as if the downtrend is gathering steam. I drew the bottom blue line parallel to the top one as of the nearest minor low from the end of the chart. Notice that today's (Friday's) price bar cuts through the line, signaling a downward breakout.
$ $ $
I pre-released a new version of Patternz, 7.0.0.51 which has big speed improvements, with faster loading and faster candle processing. I'm still working on improving the program's features.
$ $ $
![]()
The following is a brief review of how the markets performed over time. The numbers refer to the close-to-close move in the Dow industrials.
Many options expire this week, so traders will be looking to close out their positions, and that suggests increased volatility (large daily price swings).
![]()
The following is based on an SFO article in December 2004 by John Seekinger, titled, "Take a two-dimensional approach." He offers these tips.
| Index | S2 | S1 | Pivot | R1 | R2 |
| Dow Industrials (^DJI): Daily | 31,400 | 31,655 | 32,038 | 32,293 | 32,677 |
| Weekly | 30,633 | 31,271 | 32,422 | 33,060 | 34,211 |
| Monthly | 30,127 | 31,018 | 32,675 | 33,566 | 35,223 |
| S&P500 (^GSPC): Daily | 3,793 | 3,827 | 3,881 | 3,915 | 3,968 |
| Weekly | 3,697 | 3,779 | 3,929 | 4,011 | 4,161 |
| Monthly | 3,631 | 3,746 | 3,961 | 4,077 | 4,292 |
| Nasdaq (^IXIC): Daily | 10,922 | 11,031 | 11,202 | 11,311 | 11,482 |
| Weekly | 10,619 | 10,879 | 11,354 | 11,613 | 12,088 |
| Monthly | 10,405 | 10,772 | 11,461 | 11,828 | 12,517 |
Here are the formulas:
![]()
Earnings season is over.
Here's a symbol list of 251 chart and candlestick patterns (13 "investment grade" candle patterns) found in today's securities using my version of Patternz: DDD, ANF, ACIW, ADBE, ADTN, AJRD, APD, ATSG, ALK, ALB, ALGT, AYX, AEP, AEL, AXP, AIG, APH, ANIK, APOG, AAPL, AIZ, AGO, AVNT, AZTA, BCPC, BSET, BECN, BBBY, BKH, BOOT, BR, BBW, BG, CLS, CX, CENX, CDAY, CRL, CIEN, CTAS, CSCO, CNO, CNX, CTSH, CMCO, COST, COTY, CR, CCRN, CCK, CSGS, DFS, DSGR, ^DJT, DOV, EBAY, EIX, WIRE, EPAM, RE, EVRG, EVH, EXC, EXPD, FAST, FIS, FLS, FORM, GPS, IT, GPN, GL, GMS, GS, HBI, HSC, HAYN, HTLD, HELE, HOLX, DHI, HUM, IEX, IDXX, NSP, IIIN, TILE, INTU, JKHY, KMT, KFRC, KSS, LRCX, LEG, LNC, RAMP, LXU, M, MRO, MCHX, MAS, MA, MTDR, MTRN, MTRX, MDC, MRCY, META, MGEE, MLKN, MYGN, NFG, NCR, NTAP, NJR, NWL, NKE, NI, NWPX, NOVT, OXY, OLN, OMC, ASGN, PKG, PYPL, PRFT, PKI, PNW, PPL, QTWO, KWR, RMBS, RJF, RTX, RGA, RNG, RHI, ROK, RES, R, SCHW, SAIC, SEIC, SMTC, SHOP, LUV, SWX, SWN, SCS, SSYS, TPR, TECH, TPX, TKR, TDG, TRV, TZOO, TWLO, UNM, VFC, VECO, VRSN, V, WERN, WU, WMB, ITA, IYM, IAI, IYC, IYE, ITB, IEZ, IHE, FTEC, FDN, FXL, BOTZ, IAT, IGE, IYF, EWO, EWZ, ECH, EEM, EWH, EIS, EWM, EWW, EPP, EWS, EZA, EWD, EWT, QLD, PPA, DBA, PEJ, PXJ, PHO, ROBO, IXN, XLP, XLE, GLD, XHB, XLI, XRT, XAR, XLK, XLU, UNG. Click this link for details (pattern type, start and end dates).
For a list of small patterns (those a few days wide) click this link.
The below industries were the best (rank 1) or worst performing of those I follow.
|
-- Thomas Bulkowski
![]()
$ $ $
Here's a symbol list of 237 chart and candlestick patterns (13 "investment grade" candle patterns) found in today's securities using my version of Patternz: DDD, ANF, ACN, ACIW, ADBE, A, ATSG, AEP, AEL, AMWD, AME, APH, APA, APOG, AAPL, ADM, ARW, ASH, AIZ, ATO, AVY, AVNT, AXS, BMI, BCPC, BECN, BBBY, BIG, BKH, BA, BR, BBW, CPB, CE, CX, CNC, CENX, CF, CHKP, CIEN, CTAS, CSCO, CL, CMCO, CMTL, COP, COST, CCK, DHR, FANG, ^DJU, ^DJT, ECL, EIX, ELV, EME, WIRE, EOG, EXC, EXPD, FAST, FE, FLS, FMC, FTV, IT, GE, GPN, GL, GOOGL, GGG, HLIT, HSC, HAYN, HSIC, HD, HWM, JBHT, IDXX, ITW, IIIN, IPG, IPI, INTU, ISRG, NVTA, IRM, JKHY, JAZZ, KELYA, KMT, LAMR, LNC, L, MANH, MRO, MLM, MAS, MA, MTRX, MRCY, META, MOS, MYGN, ^IXIC, NFG, NOV, NFLX, NJR, NKE, NI, NUS, NTNX, OXY, OGE, OLN, OUT, OMI, PKG, PANW, PKE, PAYX, PNW, POR, PPG, PPL, PG, QTWO, QCOM, DGX, RMBS, RTX, RGS, RGA, ROK, RCKY, RES, ^GSPC, SAIA, SLB, SCHW, SEE, SRE, SMTC, SHOP, LUV, SWX, SWN, SR, TGT, TDC, TXN, TXT, TKR, TJX, TDG, TRV, TZOO, TG, TWLO, UHAL, UPS, VFC, VMI, VRSN, VMC, WSO, WERN, WU, WLK, WEX, WOLF, WWW, ZBRA, IAI, IYK, IYC, FTEC, FXI, BOTZ, QQQ, ICF, IAT, IGV, IYF, IHI, EWA, EWK, EWZ, EWC, ECH, EEM, EIS, EWW, EPP, EWS, EWD, EWL, THD, EWU, QLD, PPA, PBE, PEJ, PXJ, ROBO, IXN, ILF, SSO, MXI, XLP, XHB, XLI, XLB, XRT, SPY, XLK, XLU, UNG, VIS, VAW, MGK. Click this link for details (pattern type, start and end dates).
For a list of small patterns (those a few days wide) click this link.
$ $ $
You can find setups based on a Fibonacci retrace by clicking on the link.
The following patterns were found manually, not using Patternz. Mr. Bulkowski has excluded any securities he owns from appearing in the list. However, he may add any of the securities listed to his portfolio at any time, just as you can.
In the table below, the red and green colors are based on the historical breakout direction for the associated chart pattern. If a high and tight flag appears, the start and end dates highlight the flagpole only and not the flag.
For details about the chart patterns, click here.
-- Thomas Bulkowski
![]()
| Symbol | Chart Pattern | Bullish Bearish | Start | End | Industry |
| AYX | Double Top, Eve and Adam | 02/14/2023 | 03/06/2023 | Computer Software and Svcs | |
| ANIK | Dead-cat bounce | 03/07/2023 | 03/07/2023 | Biotechnology | |
| APOG | Double Top, Eve and Adam | 02/03/2023 | 03/03/2023 | Building Materials | |
| AAPL | Pipe bottom | 02/21/2023 | 02/27/2023 | Computers and Peripherals | |
| ARCB | Roof, inverted | 02/08/2023 | 03/09/2023 | Trucking/Transp. Leasing | |
| AVY | Triangle, descending | 02/07/2023 | 03/06/2023 | Packaging and Container | |
| AXS | Double Top, Adam and Adam | 01/27/2023 | 02/09/2023 | Insurance (Prop/Casualty) | |
| RE | Double Top, Adam and Adam | 02/09/2023 | 03/01/2023 | Insurance (Prop/Casualty) | |
| EXPD | Pipe bottom | 02/21/2023 | 02/27/2023 | Air Transport | |
| FISV | Diamond top | 02/08/2023 | 03/01/2023 | IT Services | |
| GNW | Double Top, Adam and Eve | 02/15/2023 | 02/27/2023 | Insurance (Life) | |
| GPN | Double Top, Adam and Eve | 02/02/2023 | 02/15/2023 | Computer Software and Svcs | |
| GOOGL | Pipe bottom | 02/21/2023 | 02/27/2023 | Internet | |
| GGG | Triangle, descending | 02/09/2023 | 03/09/2023 | Machinery | |
| GFF | Head-and-shoulders top | 01/18/2023 | 02/16/2023 | Building Materials | |
| HSC | Horn top | 02/13/2023 | 02/27/2023 | Diversified Co. | |
| HAYN | Triangle, symmetrical | 01/24/2023 | 02/28/2023 | Building Materials | |
| HNI | Head-and-shoulders top | 02/03/2023 | 03/03/2023 | Furn/Home Furnishings | |
| DHI | Broadening bottom | 02/22/2023 | 03/03/2023 | Homebuilding | |
| HOV | Pipe bottom | 02/13/2023 | 02/21/2023 | Homebuilding | |
| INTC | Scallop, descending | 02/15/2023 | 03/06/2023 | Semiconductor | |
| IPG | Pipe top | 01/30/2023 | 02/06/2023 | Advertising | |
| MANH | Double Top, Eve and Eve | 02/15/2023 | 03/06/2023 | IT Services | |
| MA | Double Bottom, Adam and Adam | 02/24/2023 | 03/01/2023 | Financial Services | |
| MTRX | Scallop, descending | 02/07/2023 | 03/06/2023 | Oilfield Svcs/Equipment | |
| NXGN | Double Top, Adam and Adam | 02/02/2023 | 02/15/2023 | Healthcare Information | |
| ORI | Triple top | 01/26/2023 | 02/28/2023 | Insurance (Prop/Casualty) | |
| PYPL | Scallop, descending | 02/02/2023 | 03/06/2023 | Financial Services | |
| PGR | Broadening top, right-angled and ascending | 02/17/2023 | 03/09/2023 | Insurance (Prop/Casualty) | |
| QTWO | Three Falling Peaks | 02/02/2023 | 03/03/2023 | E-Commerce | |
| SAIC | Double Top, Eve and Eve | 02/16/2023 | 03/03/2023 | IT Services | |
| SMG | Double Top, Adam and Adam | 02/16/2023 | 03/06/2023 | Chemical (Basic) | |
| SIGI | Triple top | 02/07/2023 | 02/28/2023 | Insurance (Prop/Casualty) | |
| SHOP | Pipe bottom | 02/21/2023 | 02/27/2023 | E-Commerce | |
| SCCO | Broadening top | 02/09/2023 | 03/03/2023 | Metals and Mining (Div.) | |
| V | Double Bottom, Adam and Adam | 02/24/2023 | 03/01/2023 | Financial Services | |
| WERN | Broadening bottom | 02/14/2023 | 03/06/2023 | Trucking/Transp. Leasing |
![]()
Since I post this the night before, check how the futures are trading before market open. Large moves can affect the opening direction.
$ $ $
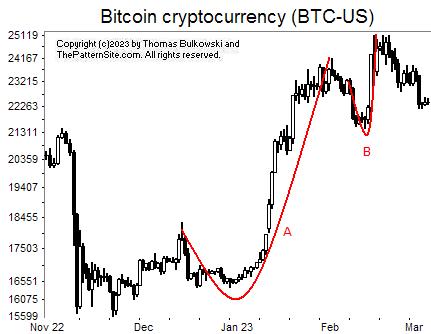
I show a picture of the cryptocurrency bitcoin, BTC-USD.
At A, the currency formed what's called an ascending scallop. A smaller and more narrow scallop happens at B.
Often when you see several scallops in a row, they will get narrower as they ascend the price chart. That signals the end of the uptrend is near. In a few cases, I've seen the reverse, with scallops getting wider and taller as they ascend, also signaling a trend end nearing.
However, it does look like the currency is getting tired, that it's taking a break before setting off in a new direction.
In this case, there's only two scallops (I like to see three in a row, each consecutively narrower or wider than the previous one), so the jury is out as to what it might portend.
$ $ $
Here's a symbol list of 106 chart and candlestick patterns (13 "investment grade" candle patterns) found in today's securities using my version of Patternz: DDD, AYI, ADBE, ADTN, APD, ATSG, AME, AON, AAPL, ADSK, AXS, BBBY, BA, BOOT, BAH, BFH, CHKP, GLW, CSGS, EOG, RE, EVRG, EXPD, FARO, FIVN, GD, GL, GOOGL, HSC, HIG, HAYN, HL, HNI, HOLX, DHI, JBHT, HURC, IPG, INTU, NVTA, JBLU, JNJ, KALU, KBAL, LZB, RAMP, L, MTSI, M, MRTN, MAS, MA, MTRX, MDC, NBR, NCR, NEE, NTNX, OMCL, PKE, PXD, PINC, PGR, DGX, RTX, REGN, RGS, RGA, RCKY, ROL, ROST, NOW, SHOP, STR, SNPS, TECH, TDY, TKR, RIG, TRV, TWLO, VMI, V, ITB, FDN, FXI, IAT, SOXX, SLV, IYF, ECH, EWH, EIS, EWS, EZA, QLD, PBE, GLD, XRT. Click this link for details (pattern type, start and end dates).
For a list of small patterns (those a few days wide) click this link.
$ $ $
The following table shows where Fibonacci retrace values of the day's high-low range are plus pivot points, calculated on the Nasdaq composite, sorted by value. When several are near each other (small differences), the area might act as support or resistance.
-- Thomas Bulkowski
![]()
| © 2023 ThePatternSite.com Metric | Value | Diff | Close (within 10% of the high-low range for the day)? |
| Monthly S2 | 10,710.45 | ||
| Weekly S2 | 11,090.39 | 379.95 | |
| Monthly S1 | 11,143.22 | 52.83 | |
| Weekly S1 | 11,333.20 | 189.97 | |
| Daily S2 | 11,441.51 | 108.32 | |
| Low | 11,487.75 | 46.24 | |
| Daily S1 | 11,508.76 | 21.01 | |
| Weekly Pivot | 11,516.41 | 7.66 | Yes! The Weekly Pivot is close to the Daily S1. |
| 61.8% Down from Intraday High | 11,531.10 | 14.69 | |
| 50% Down from Intraday High | 11,544.49 | 13.39 | |
| Open | 11,553.09 | 8.60 | Yes! The Open is close to the 50% Down from Intraday High. |
| Daily Pivot | 11,554.99 | 1.90 | Yes! The Daily Pivot is close to the Open. |
| 38.2% Down from Intraday High | 11,557.88 | 2.89 | Yes! The 38.2% Down from Intraday High is close to the Daily Pivot. |
| Close | 11,576.00 | 18.12 | |
| High | 11,601.23 | 25.23 | |
| Daily R1 | 11,622.24 | 21.01 | |
| Daily R2 | 11,668.47 | 46.24 | |
| Monthly Pivot | 11,706.39 | 37.91 | |
| Weekly R1 | 11,759.22 | 52.83 | |
| Weekly R2 | 11,942.43 | 183.22 | |
| Monthly R1 | 12,139.16 | 196.73 | |
| Monthly R2 | 12,702.33 | 563.16 |
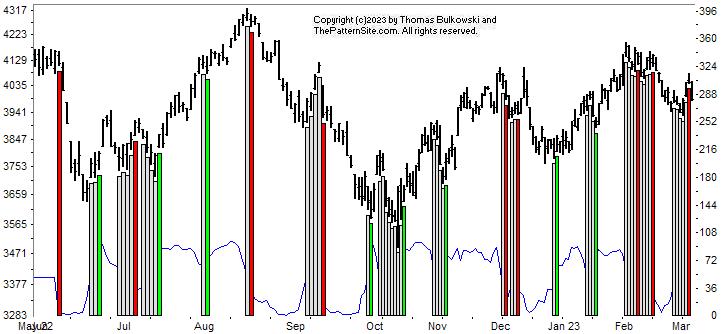
This is a picture of the chart pattern indicator on the daily scale. The indicator is the line chart below a chart of the S&P 500 composite.
This chart is bearish, as the vertical red bar on the far right of the chart shows.
We've had a cluster of red-neutral swing, something I can't recall seeing (that means I wasn't looking for it).
I noticed yesterday that the CPI turned bearish right at the peak. That surprised me because price had climbed to a relative high and yet the CPI had turned bearish. Today, the bearish signal remains.
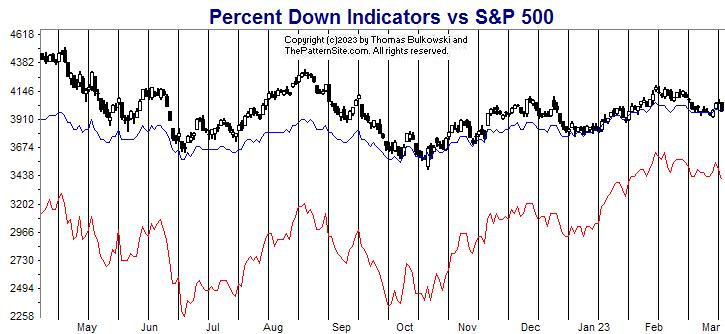
The red line is the percentage of stocks at least 20% below their 1-year high (plotted upside down). The blue line is the average percentage drop of stocks below their 1-year high (plotted upside down).
On Tuesday, 40% of stocks in my database are in bear market territory (down at least 20% from their 1-year high).A week ago, it was 39%.The fewest was 32% on 02/02/2023.And the most was 81% on 06/17/2022.
The 520 stocks in my database are down an average of 20% from their yearly high.A week ago, the average was 20%.The peak was 17% on 02/02/2023.And the bottom was 34% on 09/30/2022.
Not much as changed over the prior week. The red line is a touch more bearish this week.
The chart shows the red line trending lower after peaking in late January.
Both charts are bearish. This chart isn't as bearish as the CPI chart. I say that because the drop this week compared to prior weeks is minor, just one percentage point (red line only). The CPI chart seems to indicate that the upward retrace has ended. We'll continue moving lower for a time.
$ $ $
Here's a symbol list of 205 chart and candlestick patterns (13 "investment grade" candle patterns) found in today's securities using my version of Patternz: DDD, ABT, ACIW, ADBE, AMD, APD, ATSG, ALB, ALKS, DOX, AEE, AEP, AIG, ABC, AME, AMGN, APH, ANIK, AON, AAPL, AMAT, ATO, ADSK, AVA, AXS, AZTA, BMI, BALL, BECN, BBBY, BERY, BMRN, BKH, BA, BOOT, BAH, BLDR, CACI, CPB, CRL, CTAS, ED, GLW, CCK, CSGS, DUK, ECL, ELV, EOG, EFX, EXC, EXPD, FFIV, FDS, FDX, FE, FIVN, FLEX, FORM, FCX, GD, GL, GOOGL, GPRO, HSC, HIG, HAYN, HSII, HSIC, HNI, HD, HON, HOV, IDXX, ITW, INCY, IBP, INTC, IPG, ISRG, JKHY, JBLU, JNJ, KALU, KBAL, KMB, LAMR, LLY, L, LOW, M, MRTN, MA, MTDR, MTRX, MDT, MSFT, MCO, NBR, NCR, NTGR, NJR, NEWR, NEU, JWN, OLN, ASGN, OMI, PKE, PCTY, PEN, PKI, PXD, POR, PPL, PINC, PGR, QTWO, RTX, REGN, RGS, ROK, RCKY, ROL, ROST, SMG, SEIC, SRE, SMTC, SHW, SHOP, STR, SWX, SR, SPSC, TECH, TDY, TEVA, TKR, TJX, RIG, TRV, TWLO, SLCA, UIS, VFC, VMI, VECO, VRTX, V, WRB, WMT, WAT, WEX, WSM, XEL, ZBRA, ITB, IDU, DDM, FDN, FXI, IYH, SLV, ECH, EEM, EIS, EWI, EWY, EWP, EWD, EWL, QLD, PEJ, PXJ, PJP, PHO, SSO, XLP, XLU. Click this link for details (pattern type, start and end dates).
For a list of small patterns (those a few days wide) click this link.
-- Thomas Bulkowski
![]()
$ $ $
I show another slider trading quiz featuring Tuesday Morning: TUES stock.
$ $ $
Here's a symbol list of 197 chart and candlestick patterns (13 "investment grade" candle patterns) found in today's securities using my version of Patternz: MMM, ABT, ANF, ALGT, DOX, AMED, AXP, ANIK, AAPL, AMAT, ARCB, AWI, AIZ, AVY, AVA, AXS, AZTA, BMI, BALL, BSET, BECN, BERY, BIO, BMRN, BKH, BRC, BBW, BLDR, CAL, CE, CRL, CIEN, CMTL, ED, CONN, GLW, CCK, CTS, DDS, DSGR, ^DJT, DRQ, ECL, EMR, EZPW, FFIV, FARO, FLS, FORM, FRD, GE, GMS, GOOGL, GPRO, GES, HIG, HAYN, HQY, HL, HSII, HNI, HOV, HURC, INCY, IBP, IIIN, INTC, IBKR, NVTA, JKHY, JNJ, KALU, KELYA, KBAL, LRCX, LNC, RAMP, LMT, L, MTSI, MANH, MAN, MRTN, MAS, MDC, MDT, MSFT, MLKN, NCR, NTGR, NEWR, NOC, NWPX, NTNX, OLN, OMI, OXM, PKG, PATK, PYPL, PKI, PCG, PPG, PSTG, QTWO, RL, RGS, RLI, ROK, RCKY, SBH, SMG, SMTC, SHW, SKYW, SMAR, SR, SXI, SSYS, TFX, TER, TEVA, TTD, TKR, TSCO, RIG, TG, TREX, TWLO, SLCA, UIS, UPS, VECO, WRB, WERN, WEX, ZBRA, IYM, IYK, ITB, DDM, FTEC, BOTZ, IYZ, EWO, EWQ, EWG, EWI, EWJ, IBB, PBE, PEJ, PJP, PHO, IXN, MXI, XLF, XLB, XRT, XLK, VAW, MGK. Click this link for details (pattern type, start and end dates).
For a list of small patterns (those a few days wide) click this link.
$ $ $
The following table shows where Fibonacci retrace values of the day's high-low range are plus pivot points, calculated on the Dow industrials, sorted by value. When several are near each other (small differences), the area might act as support or resistance.
-- Thomas Bulkowski
![]()
| © 2023 ThePatternSite.com Metric | Value | Diff | Close (within 10% of the high-low range for the day)? |
| Monthly S2 | 31,588.29 | ||
| Weekly S2 | 32,207.55 | 619.25 | |
| Monthly S1 | 32,509.87 | 302.32 | |
| Weekly S1 | 32,819.49 | 309.63 | |
| Weekly Pivot | 33,112.66 | 293.16 | |
| Daily S2 | 33,273.63 | 160.97 | |
| Daily S1 | 33,352.54 | 78.91 | |
| Low | 33,383.47 | 30.93 | |
| Monthly Pivot | 33,422.29 | 38.82 | |
| Open | 33,425.32 | 3.04 | Yes! The Open is close to the Monthly Pivot. |
| Close | 33,431.44 | 6.12 | Yes! The Close is close to the Open. |
| 61.8% Down from Intraday High | 33,455.57 | 24.13 | |
| Daily Pivot | 33,462.38 | 6.80 | Yes! The Daily Pivot is close to the 61.8% Down from Intraday High. |
| 50% Down from Intraday High | 33,477.84 | 15.47 | Yes! The 50% Down from Intraday High is close to the Daily Pivot. |
| 38.2% Down from Intraday High | 33,500.12 | 22.27 | |
| Daily R1 | 33,541.29 | 41.17 | |
| High | 33,572.22 | 30.93 | |
| Daily R2 | 33,651.13 | 78.91 | |
| Weekly R1 | 33,724.60 | 73.48 | |
| Weekly R2 | 34,017.77 | 293.16 | |
| Monthly R1 | 34,343.86 | 326.09 | |
| Monthly R2 | 35,256.27 | 912.42 |
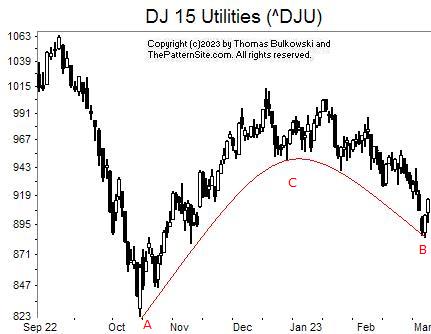
This is a chart of the Dow utilities on the daily scale.
Not much is happening on this chart. At AB, we see a pattern called an inverted and ascending scallop.
That chart pattern starts out from a valley (A), rounds over at C and drops to B. B remains above A, often by a large amount such as that shown here. In a bull market in stocks, 95% of them breakout upward.
What's a breakout? That happens when the stock (or index) closes above the top of the chart pattern after the B bottom. That hasn't happened yet. Indeed, the index could continue lower and not be a IA scallop at all.
The average retrace of the CB drop as a percentage of the AC rise is 54%, or about halfway down before the security turns up.
![]()
The following is a brief review of how the markets performed over time. The numbers refer to the close-to-close move in the Dow industrials.
No options expire this week.
![]()
The following is based on an SFO article in December 2004 by John Seekinger, titled, "Take a two-dimensional approach." He offers these tips.
| Index | S2 | S1 | Pivot | R1 | R2 |
| Dow Industrials (^DJI): Daily | 32,871 | 33,131 | 33,268 | 33,528 | 33,666 |
| Weekly | 32,194 | 32,793 | 33,099 | 33,698 | 34,004 |
| Monthly | 31,575 | 32,483 | 33,409 | 34,317 | 35,243 |
| S&P500 (^GSPC): Daily | 3,977 | 4,011 | 4,030 | 4,064 | 4,083 |
| Weekly | 3,887 | 3,966 | 4,007 | 4,087 | 4,127 |
| Monthly | 3,789 | 3,917 | 4,056 | 4,185 | 4,324 |
| Nasdaq (^IXIC): Daily | 11,450 | 11,569 | 11,634 | 11,754 | 11,819 |
| Weekly | 11,128 | 11,409 | 11,554 | 11,835 | 11,980 |
| Monthly | 10,748 | 11,219 | 11,744 | 12,215 | 12,740 |
Here are the formulas:
![]()
Earnings season is over.
Here's a symbol list of 151 chart and candlestick patterns (13 "investment grade" candle patterns) found in today's securities using my version of Patternz: AXDX, ADBE, AMD, AJRD, AFL, A, ALRM, AYX, AEP, AEL, AIG, ANET, ADSK, AVY, AZTA, BZH, BIO, BKNG, BRC, BR, BRKR, CBT, CAL, CX, CENX, CDAY, CSCO, CMTL, CONN, CSGP, COTY, CCK, DHR, DFS, ^DJU, EL, EVRG, EXC, FFIV, FICO, FTNT, IT, GE, GGG, GFF, HL, HSIC, HOLX, HD, HOV, HWM, IDXX, ITW, IIIN, ISRG, KBH, KELYA, KBAL, LAMR, LDOS, MHO, MCHX, MKTX, MLM, META, MLKN, MOS, ^IXIC, NI, NWPX, NVDA, OGE, OTEX, PEN, PKI, PETS, PFE, PCG, PPG, PPL, PHM, QTWO, RMBS, RGS, RES, ^GSPC, SLB, NOW, SHOP, SCCO, SWN, SCS, TER, TMO, TKR, TOL, TRV, TWLO, SLCA, UNM, VLO, VEEV, VRSN, VC, WSO, WMB, WDAY, XEL, IYK, IEZ, IDU, FTEC, FDN, QTEC, FXL, BOTZ, QQQ, SOXX, IHI, EWK, ECH, EWQ, EWG, EWI, EWJ, EWL, THD, EWU, QLD, PXJ, PJP, PHO, ROBO, IXN, SSO, MXI, GLD, XHB, XRT, SPY, XLK, XLU, USO, SMH, MGK. Click this link for details (pattern type, start and end dates).
For a list of small patterns (those a few days wide) click this link.
The below industries were the best (rank 1) or worst performing of those I follow.
|
-- Thomas Bulkowski
![]()
$ $ $
Here's a symbol list of 144 chart and candlestick patterns (13 "investment grade" candle patterns) found in today's securities using my version of Patternz: ABT, AYI, AKAM, DOX, AMWD, AMN, APOG, AMAT, AWI, AIZ, BMI, BBBY, BBY, BIO, BAH, BRC, BR, BBW, CBT, CLS, CF, CRL, CHD, CLNE, CLF, CTSH, GLW, COTY, CRH, CCK, DECK, BOOM, EVRG, FFIV, FDS, FARO, FORM, FTV, GME, GD, GE, GIS, GMS, GGG, GFF, GES, HSC, HOLX, HON, HOV, IEX, IDXX, INFN, PODD, IBKR, IPG, IPI, KBAL, LHX, LZB, M, MKTX, MAS, MDC, MDT, MGEE, MU, NCR, NKE, NOC, NWPX, OMC, OTEX, OUT, PAYX, PKI, PLXS, PRU, RTX, ROK, RCKY, CRM, SEIC, STR, SPSC, SUM, SNPS, TDOC, TDY, TDC, TXT, TRV, TREX, TWLO, SLCA, VFC, MDRX, WRB, WERN, WU, IAI, IYK, IYC, IDU, FTEC, FXI, IYH, IAT, IYF, EWK, EEM, EWG, EWH, EWS, EWT, EWU, PPA, PXJ, PJP, IXN, SSO, XLV, XLI, VIS. Click this link for details (pattern type, start and end dates).
For a list of small patterns (those a few days wide) click this link.
$ $ $
You can find setups based on a Fibonacci retrace by clicking on the link.
The following patterns were found manually, not using Patternz. Mr. Bulkowski has excluded any securities he owns from appearing in the list. However, he may add any of the securities listed to his portfolio at any time, just as you can.
In the table below, the red and green colors are based on the historical breakout direction for the associated chart pattern. If a high and tight flag appears, the start and end dates highlight the flagpole only and not the flag.
For details about the chart patterns, click here.
-- Thomas Bulkowski
![]()
| Symbol | Chart Pattern | Bullish Bearish | Start | End | Industry |
| ATSG | Dead-cat bounce | 02/24/2023 | 02/24/2023 | Air Transport | |
| AMWD | Three Falling Peaks | 02/02/2023 | 02/27/2023 | Building Materials | |
| AAPL | Double Top, Adam and Adam | 02/03/2023 | 02/16/2023 | Computers and Peripherals | |
| AVNT | Pipe bottom | 02/06/2023 | 02/13/2023 | Chemical (Specialty) | |
| BMI | Broadening top, right-angled and descending | 02/07/2023 | 02/28/2023 | Precision Instrument | |
| BIG | Double Top, Adam and Adam | 01/13/2023 | 02/02/2023 | Retail Store | |
| BMY | Double Top, Adam and Adam | 01/24/2023 | 02/06/2023 | Drug | |
| BRKR | Pipe top | 02/06/2023 | 02/13/2023 | Precision Instrument | |
| CHS | Ugly double bottom | 01/19/2023 | 02/24/2023 | Apparel | |
| CMI | Broadening top | 01/31/2023 | 02/24/2023 | Machinery | |
| ECL | Broadening top | 01/12/2023 | 02/16/2023 | Chemical (Specialty) | |
| EXPD | Double Bottom, Adam and Adam | 02/21/2023 | 03/01/2023 | Air Transport | |
| FMC | Triangle, symmetrical | 02/06/2023 | 03/02/2023 | Chemical (Basic) | |
| GPS | Pipe top | 01/30/2023 | 02/06/2023 | Apparel | |
| GILD | Three Falling Peaks | 12/13/2022 | 02/13/2023 | Biotechnology | |
| GMS | Broadening top | 02/02/2023 | 03/02/2023 | Cement and Aggregates | |
| GS | Diamond top | 02/02/2023 | 02/16/2023 | Securities Brokerage | |
| HSIC | Horn top | 01/30/2023 | 02/13/2023 | Medical Supplies | |
| NVTA | Dead-cat bounce | 03/01/2023 | 03/01/2023 | Medical Services | |
| K | Broadening top, right-angled and ascending | 01/20/2023 | 02/22/2023 | Food Processing | |
| KSS | Head-and-shoulders top | 01/26/2023 | 02/15/2023 | Retail Store | |
| LH | Triple top | 01/24/2023 | 02/17/2023 | Medical Services | |
| MTSI | Ugly double bottom | 01/20/2023 | 02/03/2023 | Semiconductor | |
| NXGN | Double Top, Adam and Adam | 02/02/2023 | 02/15/2023 | Healthcare Information | |
| NI | Double Bottom, Adam and Adam | 02/09/2023 | 02/16/2023 | Electric Utility (Central) | |
| ON | Pipe top | 02/06/2023 | 02/13/2023 | Semiconductor | |
| OMI | Dead-cat bounce | 02/28/2023 | 02/28/2023 | Medical Supplies | |
| PCTY | Pipe top | 01/30/2023 | 02/06/2023 | E-Commerce | |
| PINC | Double Top, Adam and Eve | 02/02/2023 | 02/21/2023 | Healthcare Information | |
| PEG | Head-and-shoulders complex top | 12/01/2022 | 02/27/2023 | Electric Utility (East) | |
| RRC | Triple bottom | 01/04/2023 | 02/21/2023 | Petroleum (Producing) | |
| RNG | Horn top | 01/30/2023 | 02/13/2023 | Computer Software and Svcs | |
| ROP | Falling wedge | 12/20/2022 | 02/16/2023 | Industrial Services | |
| ROST | Double Top, Adam and Eve | 01/06/2023 | 01/27/2023 | Retail (Special Lines) | |
| SKX | Double Bottom, Eve and Eve | 02/08/2023 | 02/24/2023 | Shoe | |
| SMAR | Triangle, symmetrical | 02/02/2023 | 03/02/2023 | E-Commerce | |
| SR | Pipe top | 01/30/2023 | 02/06/2023 | Natural Gas (Distributor) | |
| SUM | Horn top | 01/30/2023 | 02/13/2023 | Cement and Aggregates | |
| TDOC | Head-and-shoulders top | 01/24/2023 | 02/15/2023 | Healthcare Information | |
| TDC | Pennant | 02/16/2023 | 02/28/2023 | Computer Software and Svcs | |
| TREX | Double Top, Adam and Adam | 02/02/2023 | 02/09/2023 | Building Materials | |
| SLCA | Pipe bottom | 02/13/2023 | 02/21/2023 | Metals and Mining (Div.) | |
| WWW | Pipe bottom | 02/06/2023 | 02/13/2023 | Shoe |
![]()
Since I post this the night before, check how the futures are trading before market open. Large moves can affect the opening direction.
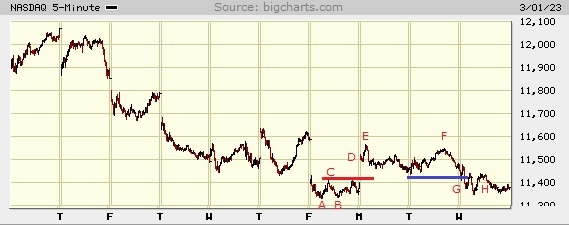
$ $ $
I show a picture of the Nasdaq composite on the 5-minute scale.
This chart looks complicated, but it's really not.
At AB, we see a double bottom. It confirms as a valid chart pattern when the index closes above the highest peak between the two bottoms. I show that level with red line C. It confirms when the market gaps up higher at D.
EF is the reverse pattern, a double top. It confirms at G, the blue line.
At H, we see two bottoms that are a potential double bottom. It is unconfirmed as yet (price has to close above the peak at H). It looks promising that the index will confirm it tomorrow or the next day.
$ $ $
Here's a symbol list of 147 chart and candlestick patterns (13 "investment grade" candle patterns) found in today's securities using my version of Patternz: DDD, ANF, ACIW, A, AA, ALKS, AEE, AEP, AIG, ADM, AIZ, ATO, BCPC, BSET, BKH, BRC, BBW, CENX, CLNE, CTSH, CL, ED, COST, XRAY, ^DJU, DOV, DTE, DUK, EVRG, EXC, FFIV, FDS, FCX, GME, GPS, GNW, GL, GES, HBI, THG, HAYN, HOLX, HD, HOV, IBP, ITGR, IPAR, IPG, NVTA, JKHY, K, KELYA, KLIC, LZB, LANC, LNC, MGY, MKTX, MAS, MTDR, MDT, MU, MSFT, MOS, MYGN, NOV, NCR, NJR, NOVT, NUS, OMCL, PTEN, PPL, PINC, DGX, RGS, RCKY, SBH, SAIC, SEE, SRE, SHOP, SLGN, SO, SCCO, SR, SCS, SUM, TPR, TKR, TJX, TDG, TG, TWLO, SLCA, UGI, MDRX, VC, WU, WLK, WSM, WOLF, WWW, IAI, IYK, IYC, IDU, FTEC, QTEC, ICF, IAT, EWO, EWQ, EWI, EZA, EWL, THD, TUR, PJP, IEV, IXN, SSO, MXI, XLP, GLD, XLK, XLU, USO. Click this link for details (pattern type, start and end dates).
For a list of small patterns (those a few days wide) click this link.
$ $ $
The following table shows where Fibonacci retrace values of the day's high-low range are plus pivot points, calculated on the Nasdaq composite, sorted by value. When several are near each other (small differences), the area might act as support or resistance.
-- Thomas Bulkowski
![]()
| © 2023 ThePatternSite.com Metric | Value | Diff | Close (within 10% of the high-low range for the day)? |
| Monthly S2 | 10,127.66 | ||
| Monthly S1 | 10,753.57 | 625.91 | |
| Weekly S2 | 11,116.36 | 362.79 | |
| Weekly S1 | 11,247.92 | 131.56 | |
| Daily S2 | 11,273.65 | 25.73 | |
| Daily S1 | 11,326.57 | 52.91 | |
| Low | 11,349.87 | 23.30 | |
| Close | 11,379.48 | 29.61 | |
| 61.8% Down from Intraday High | 11,399.20 | 19.72 | |
| Daily Pivot | 11,402.78 | 3.59 | Yes! The Daily Pivot is close to the 61.8% Down from Intraday High. |
| 50% Down from Intraday High | 11,414.43 | 11.65 | Yes! The 50% Down from Intraday High is close to the Daily Pivot. |
| 38.2% Down from Intraday High | 11,429.67 | 15.24 | |
| Open | 11,447.58 | 17.91 | |
| Daily R1 | 11,455.70 | 8.12 | Yes! The Daily R1 is close to the Open. |
| Weekly Pivot | 11,466.03 | 10.33 | Yes! The Weekly Pivot is close to the Daily R1. |
| High | 11,479.00 | 12.97 | |
| Monthly Pivot | 11,511.56 | 32.56 | |
| Daily R2 | 11,531.91 | 20.35 | |
| Weekly R1 | 11,597.59 | 65.68 | |
| Weekly R2 | 11,815.70 | 218.11 | |
| Monthly R1 | 12,137.47 | 321.77 | |
| Monthly R2 | 12,895.46 | 757.99 |
Here's the updated 2023 forecast, presented in slider format.
$ $ $
Based on sector performance from Fidelity, the best performing sectors for year-to-date performance as of 2/28/2023 were... (The numbering is how they ranked a month ago.)
The folks at two firms polled by Fidelity weigh the sectors in this order, as of 2/24/23.
Here's how they rank the industries, but only the top 10 appear. One-year change, as of 2/27/23. The numbering is how they ranked a month ago.
$ $ $
Here's a symbol list of 113 chart and candlestick patterns (13 "investment grade" candle patterns) found in today's securities using my version of Patternz: AXDX, ALGT, AEP, APH, ANIK, AMAT, ADM, ATO, AVNT, BBBY, BERY, BKH, BBW, BG, CAL, CLS, CHS, CLNE, CLF, CTSH, ED, COP, COTY, XRAY, FANG, DRQ, DTE, EMN, EOG, EFX, FIS, FDP, FRD, GE, HSII, HOLX, HOV, HUN, HURC, NSP, ITGR, IPG, INTU, K, KMB, LZB, LDOS, LLY, LOW, MRO, MTDR, MRCY, META, MUR, MYGN, NI, NWPX, NUS, ORI, OLN, OMI, PTEN, PRFT, PFE, PLXS, PPL, PINC, DGX, RL, RMBS, RES, R, SLB, SAIC, SRE, NOW, SWX, SR, SUM, TPR, TRGP, TXN, TDG, TG, TWLO, SLCA, VLO, VECO, WWD, IAI, IYK, IYE, IDU, IYH, IHF, IGE, IEO, EWO, EWZ, EWI, EWP, THD, PJP, IXC, ILF, XLP, XLE, XLB, VHT, VAW. Click this link for details (pattern type, start and end dates).
For a list of small patterns (those a few days wide) click this link.
-- Thomas Bulkowski
![]()
Support this site! Clicking any of the books (below) takes you to
Amazon.com If you buy ANYTHING while there, they pay for the referral.
Legal notice for paid links: "As an Amazon Associate I earn from qualifying purchases."
|
My Stock Market Books
|
My Novels
Orb Foresight Rewrite Coming!
|