
As of 04/02/2026
Indus: 46,505 -61.07 -0.1%
Trans: 19,089 +159.40 +0.8%
Utils: 1,174 +8.73 +0.7%
Nasdaq: 21,879 +38.23 +0.2%
S&P 500: 6,583 +7.37 +0.1%
|
YTD
-3.2%
+10.0%
+9.9%
-5.9%
-3.8%
|
|
As of 04/02/2026
Indus: 46,505 -61.07 -0.1%
Trans: 19,089 +159.40 +0.8%
Utils: 1,174 +8.73 +0.7%
Nasdaq: 21,879 +38.23 +0.2%
S&P 500: 6,583 +7.37 +0.1%
|
YTD
-3.2%
+10.0%
+9.9%
-5.9%
-3.8%
| |
|
| ||
$ $ $
I show another slider trading quiz featuring Tredegar: TG (support and resistance) stock.
$ $ $
Here's a symbol list of 66 chart and candlestick patterns (13 "investment grade" candle patterns) found in today's securities using my version of Patternz: AJRD, AFL, AMWD, AR, ADM, AVNT, AVA, AZTA, BBBY, BBY, BBW, CALM, CE, CNP, CHKP, CTSH, DDS, EIX, ELV, WIRE, EXPI, FAST, FLEX, FLS, FDP, IT, HLIT, HAYN, HQY, HUM, IIIN, IPAR, ISRG, IVC, JAZZ, KLAC, L, MLI, NXGN, OLN, PKG, PEG, REGN, ROG, ROST, R, SCHW, SCI, SCS, SRDX, SNPS, TEVA, VLO, ITA, EIS, EWW, EWP, EWU, DBA, PJP, XLY, XLV. Click this link for details (pattern type, start and end dates).
For a list of small patterns (those a few days wide) click this link.
$ $ $
The following table shows where Fibonacci retrace values of the day's high-low range are plus pivot points, calculated on the Dow industrials, sorted by value. When several are near each other (small differences), the area might act as support or resistance.
-- Thomas Bulkowski
![]()
| © 2023 ThePatternSite.com Metric | Value | Diff | Close (within 10% of the high-low range for the day)? |
| Monthly S2 | 32,093.92 | ||
| Weekly S2 | 32,827.09 | 733.17 | |
| Monthly S1 | 32,905.51 | 78.42 | |
| Weekly S1 | 33,272.09 | 366.58 | |
| Daily S2 | 33,462.41 | 190.32 | |
| Daily S1 | 33,589.75 | 127.34 | |
| Monthly Pivot | 33,623.91 | 34.16 | Yes! The Monthly Pivot is close to the Daily S1. |
| Low | 33,695.18 | 71.27 | |
| Close | 33,717.09 | 21.91 | Yes! The Close is close to the Low. |
| Weekly Pivot | 33,718.21 | 1.12 | Yes! The Weekly Pivot is close to the Close. |
| Daily Pivot | 33,822.52 | 104.31 | |
| 61.8% Down from Intraday High | 33,832.74 | 10.22 | Yes! The 61.8% Down from Intraday High is close to the Daily Pivot. |
| 50% Down from Intraday High | 33,875.23 | 42.49 | |
| Open | 33,909.21 | 33.98 | Yes! The Open is close to the 50% Down from Intraday High. |
| 38.2% Down from Intraday High | 33,917.73 | 8.52 | Yes! The 38.2% Down from Intraday High is close to the Open. |
| Daily R1 | 33,949.86 | 32.13 | Yes! The Daily R1 is close to the 38.2% Down from Intraday High. |
| High | 34,055.29 | 105.43 | |
| Weekly R1 | 34,163.21 | 107.92 | |
| Daily R2 | 34,182.63 | 19.42 | Yes! The Daily R2 is close to the Weekly R1. |
| Monthly R1 | 34,435.50 | 252.87 | |
| Weekly R2 | 34,609.33 | 173.83 | |
| Monthly R2 | 35,153.90 | 544.57 |

I show the Dow transports on the daily scale.
The red lines highlight a chart pattern that I call an inverted roof. It looks like the top half of a diamond or a roof top flipped upside down. In this case, the index rises into the start of the pattern (the move from A to B).
That incoming rise distinguishes the roof pattern (in a case like this) from a head-and-shoulders bottom or the complex variety.
No clear right shoulder mirrors the left one near the same price, so it's not a head-and-shoulders.
Inverted roof patterns breakout upward and downward about equally (51% to 49%, respectively). They are rare patterns with a performance that's near the bottom (worst) of the list.
![]()
The following is a brief review of how the markets performed over time. The numbers refer to the close-to-close move in the Dow industrials.
No options expire this week.
![]()
The following is based on an SFO article in December 2004 by John Seekinger, titled, "Take a two-dimensional approach." He offers these tips.
| Index | S2 | S1 | Pivot | R1 | R2 |
| Dow Industrials (^DJI): Daily | 33,658 | 33,818 | 33,991 | 34,151 | 34,325 |
| Weekly | 32,914 | 33,446 | 33,805 | 34,337 | 34,696 |
| Monthly | 32,181 | 33,080 | 33,711 | 34,609 | 35,241 |
| S&P500 (^GSPC): Daily | 4,026 | 4,048 | 4,071 | 4,094 | 4,117 |
| Weekly | 3,893 | 3,982 | 4,038 | 4,127 | 4,183 |
| Monthly | 3,668 | 3,869 | 3,982 | 4,183 | 4,295 |
| Nasdaq (^IXIC): Daily | 11,373 | 11,497 | 11,595 | 11,719 | 11,816 |
| Weekly | 10,838 | 11,230 | 11,461 | 11,853 | 12,084 |
| Monthly | 9,689 | 10,655 | 11,174 | 12,140 | 12,658 |
Here are the formulas:
![]()
Earnings season is either underway or should be starting soon. The sessions could be more volatile.
Here's a symbol list of 104 chart and candlestick patterns (13 "investment grade" candle patterns) found in today's securities using my version of Patternz: AXDX, ALGT, AMZN, DOX, AMED, AEP, AEL, AXP, AMN, ARCB, AVNT, AVA, BBW, CPB, CX, CNC, CNP, CVX, CHD, CNO, CL, CAG, DECK, DDS, DSGR, ^DJU, DRQ, ELV, EL, EZPW, FICO, FAST, GME, GE, GNW, GL, THG, HLIT, HAYN, HSII, HURC, IIIN, IVC, KELYA, KMT, LHX, L, MTSI, MRTN, NI, NUS, OLN, OMCL, OXM, PAYX, PLXS, POR, PPL, RJF, RNG, ROG, ROST, R, SAIA, SCHW, SMG, SHOP, SPLK, SXI, SNPS, TFX, TEVA, TG, UNH, VLO, V, VC, WERN, WSM, ZBRA, IAT, EWK, EWC, EWJ, EWW, TUR, PPA, PBE, IXN, ILF, XLY, XHB, XRT. Click this link for details (pattern type, start and end dates).
For a list of small patterns (those a few days wide) click this link.
The below industries were the best (rank 1) or worst performing of those I follow.
|
-- Thomas Bulkowski
![]()
$ $ $
Here's a symbol list of 118 chart and candlestick patterns (13 "investment grade" candle patterns) found in today's securities using my version of Patternz: AJRD, ALB, AIG, ABC, ANET, ADP, AVA, AXS, BMI, BZH, BBBY, BIO, BKH, BOOT, BBW, BLDR, CPB, CNP, CVX, CAG, COTY, DSGR, EFX, EL, EXPI, XOM, EZPW, FARO, FAST, FIS, FLS, FTNT, GNW, GS, GPRO, HLIT, HAYN, HTLD, HSII, HOV, IBP, IIIN, PODD, IPAR, IRM, JBLU, RAMP, L, M, MANH, MRTN, MTRN, MTRX, META, MGEE, MUR, NOV, NTAP, NXGN, NOVT, NUS, OXY, ORI, OMCL, PKG, PANW, PTEN, PFE, RJF, RGA, RLI, ROG, R, CRM, SCHW, SMG, SCI, SLGN, SKX, SWN, SNPS, TGT, TFX, TEVA, TSCO, TREX, TWLO, SLCA, V, WMT, WDAY, IYC, IEZ, IHE, QTEC, FXI, IYZ, IGV, EWC, EEM, EWS, EWT, PPA, DBA, PEJ, PXJ, IEV, IXC, ILF, XLY, UNG. Click this link for details (pattern type, start and end dates).
For a list of small patterns (those a few days wide) click this link.
$ $ $
You can find setups based on a Fibonacci retrace by clicking on the link.
The following patterns were found manually, not using Patternz. Mr. Bulkowski has excluded any securities he owns from appearing in the list. However, he may add any of the securities listed to his portfolio at any time, just as you can.
In the table below, the red and green colors are based on the historical breakout direction for the associated chart pattern. If a high and tight flag appears, the start and end dates highlight the flagpole only and not the flag.
For details about the chart patterns, click here.
-- Thomas Bulkowski
![]()
| Symbol | Chart Pattern | Bullish Bearish | Start | End | Industry |
| A | Ugly double bottom | 01/06/2023 | 01/19/2023 | Precision Instrument | |
| ACGL | Broadening top, right-angled and ascending | 12/27/2022 | 01/20/2023 | Insurance (Prop/Casualty) | |
| BBW | Triangle, symmetrical | 12/14/2022 | 01/26/2023 | Retail (Special Lines) | |
| CHS | Broadening bottom | 12/21/2022 | 01/25/2023 | Apparel | |
| CIEN | Triangle, symmetrical | 01/05/2023 | 01/26/2023 | Telecom. Equipment | |
| DFS | Double Bottom, Eve and Adam | 12/20/2022 | 01/19/2023 | Financial Services | |
| D | Triangle, symmetrical | 01/04/2023 | 01/26/2023 | Electric Utility (East) | |
| FARO | Dead-cat bounce | 01/20/2023 | 01/20/2023 | Precision Instrument | |
| FAST | Horn bottom | 01/03/2023 | 01/17/2023 | Retail Building Supply | |
| HLIT | Pipe top | 01/09/2023 | 01/17/2023 | Telecom. Equipment | |
| HL | Channel | 12/20/2022 | 01/26/2023 | Metals and Mining (Div.) | |
| ILMN | Broadening bottom | 12/20/2022 | 01/10/2023 | Biotechnology | |
| MRTN | Head-and-shoulders bottom | 12/20/2022 | 01/19/2023 | Trucking/Transp. Leasing | |
| OMI | Channel | 12/20/2022 | 01/23/2023 | Medical Supplies | |
| PTEN | Triangle, symmetrical | 12/01/2022 | 01/26/2023 | Oilfield Svcs/Equipment | |
| PYPL | Ugly double bottom | 12/22/2022 | 01/20/2023 | Financial Services | |
| QTWO | Broadening bottom | 12/01/2022 | 01/09/2023 | E-Commerce | |
| RGA | Triangle, symmetrical | 10/28/2022 | 01/19/2023 | Insurance (Life) | |
| SKYW | Pennant | 01/13/2023 | 01/26/2023 | Air Transport | |
| TWLO | Broadening wedge, ascending | 01/06/2023 | 01/24/2023 | E-Commerce | |
| SLCA | Triangle, symmetrical | 11/22/2022 | 01/24/2023 | Metals and Mining (Div.) | |
| UNM | Head-and-shoulders bottom | 11/17/2022 | 01/19/2023 | Insurance (Diversified) | |
| VMI | Broadening top | 12/13/2022 | 01/13/2023 | Metal Fabricating | |
| V | Broadening top | 01/11/2023 | 01/26/2023 | Financial Services |
![]()
Since I post this the night before, check how the futures are trading before market open. Large moves can affect the opening direction.
$ $ $
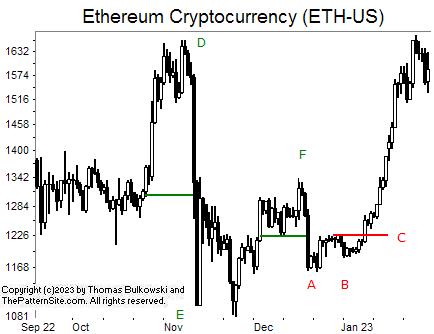
I show a picture of Ethereum (ETH-USD) on the daily scale.
A weird looking double bottom appears at AB, but perhaps it's better called an ugly double bottom. I place a minimum move of 5% for the second bottom to form a valley above the prior one. By that I mean bottom B should be at least 5% above valley A. However, that doesn't apply to indices and probably not cryptocurrency like this one. The 5% hurdle is too high for indices and maybe cryptos.
As I was looking at the picture, I noticed the moves from the green line to D mirrors the drop from the green line to E. The drop from F to the green line mirrors the drop from the green line to A. It reminds me of the trendline measure rule where the rise above the trendline mirrors the following extent of the drop.
In this case, the drops fall short of the rises, but it's an interesting observation.
Now that the currency has peaked near the height of D, I'd expect to see a drop, finding support about halfway down to B.
$ $ $
Here's a symbol list of 126 chart and candlestick patterns (13 "investment grade" candle patterns) found in today's securities using my version of Patternz: ANF, AJRD, AKAM, ALK, ALB, ALL, AMZN, AEE, AEL, AIG, AON, AMAT, ARW, AIZ, AVA, BSET, BZH, BERY, BBY, BIG, BIIB, BMRN, BCO, BRKR, BBW, BLDR, CNP, CHS, CLF, CNO, CNX, CGNX, CTSH, CMCO, CMTL, CAG, GLW, CRH, CSGS, CTS, CW, DDS, DSGR, EBAY, RE, EXC, EXPI, FAST, FORM, FDP, GD, GNW, GS, HLIT, HSII, HSIC, HNI, HOLX, IIIN, PODD, ITGR, IPI, IRM, KELYA, KEYS, KLIC, LZB, LEG, L, MRTN, MTRN, MTRX, NBR, NFG, NTNX, PKG, PDCO, PAYX, PCG, PHM, RGA, ROG, RES, R, SEIC, NOW, SHOP, STR, SMAR, SWX, SWN, SXI, TRGP, TECH, TDY, TPX, TDC, TEVA, TMO, TDG, SLCA, VMI, VEEV, WERN, WSM, WWW, XEL, IYK, IAT, IGE, EWJ, EWS, PXJ, XLV, XRT, UNG. Clink this link for details (pattern type, start and end dates).
For a list of small patterns (those a few days wide) click this link.
$ $ $
The following table shows where Fibonacci retrace values of the day's high-low range are plus pivot points, calculated on the Nasdaq composite, sorted by value. When several are near each other (small differences), the area might act as support or resistance.
-- Thomas Bulkowski
![]()
| © 2023 ThePatternSite.com Metric | Value | Diff | Close (within 10% of the high-low range for the day)? |
| Monthly S2 | 9,898.81 | ||
| Monthly S1 | 10,606.08 | 707.28 | |
| Weekly S2 | 10,694.94 | 88.86 | |
| Monthly Pivot | 10,914.75 | 219.81 | |
| Daily S2 | 10,973.88 | 59.13 | |
| Weekly S1 | 11,004.15 | 30.27 | |
| Low | 11,069.18 | 65.03 | |
| Weekly Pivot | 11,113.78 | 44.60 | |
| Daily S1 | 11,143.62 | 29.84 | |
| Open | 11,146.53 | 2.91 | Yes! The Open is close to the Daily S1. |
| 61.8% Down from Intraday High | 11,170.43 | 23.90 | Yes! The 61.8% Down from Intraday High is close to the Open. |
| 50% Down from Intraday High | 11,201.70 | 31.27 | |
| 38.2% Down from Intraday High | 11,232.97 | 31.27 | |
| Daily Pivot | 11,238.92 | 5.95 | Yes! The Daily Pivot is close to the 38.2% Down from Intraday High. |
| Close | 11,313.36 | 74.44 | |
| High | 11,334.22 | 20.86 | Yes! The High is close to the Close. |
| Daily R1 | 11,408.66 | 74.44 | |
| Weekly R1 | 11,422.99 | 14.33 | Yes! The Weekly R1 is close to the Daily R1. |
| Daily R2 | 11,503.96 | 80.97 | |
| Weekly R2 | 11,532.62 | 28.66 | |
| Monthly R1 | 11,622.02 | 89.40 | |
| Monthly R2 | 11,930.69 | 308.66 |
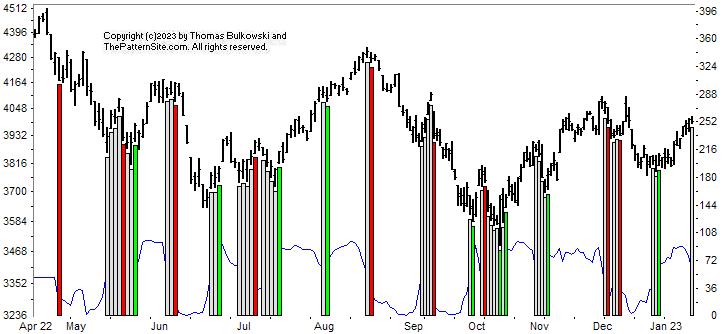
This is a picture of the chart pattern indicator on the daily scale. The indicator is the line chart below a chart of the S&P 500 composite.
The CPI chart shows the most recent signal as bullish, according to the vertical green bar on the far right of the chart. The blue indicator line shows it peaked and dropped back some today.
Is this a signal of a continued drop?
I don't know. I invented the Chart Pattern Indicator but that doesn't mean I know how it works (that's a joke). Back in July, we see the start of two green bars separated by about two weeks and that led to a continued move higher. So let's assume it's correct. This chart is bullish.
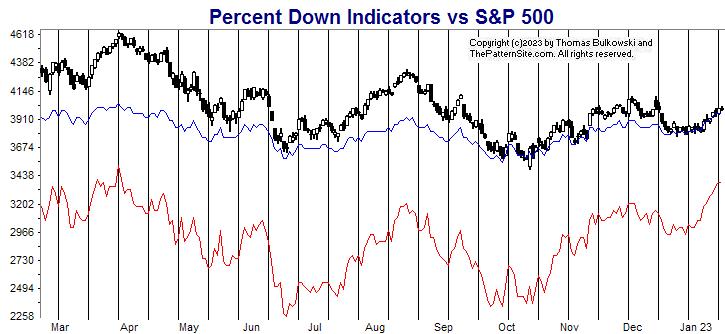
The red line is the percentage of stocks at least 20% below their 1-year high (plotted upside down). The blue line is the average percentage drop of stocks below their 1-year high (plotted upside down).
On Tuesday, 39% of stocks in my database are in bear market territory (down at least 20% from their 1-year high).A week ago, it was 41%.The fewest was 35% on 02/09/2022.And the most was 80% on 06/17/2022.
The 505 stocks in my database are down an average of 20% from their yearly high.A week ago, the average was 20%.The peak was 17% on 03/29/2022.And the bottom was 34% on 09/30/2022.
The blue line has merged with price but it shows no change from a week ago. The red line is bullish and has improved from last week's reading.
This week, we have two bullish charts, so let's go with the flow and say the markets over the coming week will be bullish. Of course, earnings are coming and that could upset things...so take care of each other.
$ $ $
I released a preliminary version of Patternz. It has a few bug fixes, better handling of decimal places (narrower chart margins, if you desire -- go to the chart form, the click Setup button and look for decimals) and broadening wedges finding and displaying have been improved. I continue to work on the program. Plan are to incorporate Weinstein's stages into the program and give more options for free quote uploading (yes, including you in England). That's my hope, but we'll see if I can complete it.
If you have suggestions for improvements to the program, let me know. Just remember that it's a pattern recognition program, and not an indicator program or a spreadsheet to keep track of your trades. I may tell you no and implement your feature anyway, so there's no harm in asking. Click this link for my email address.
Oh, and be sure to scan it for viruses.
$ $ $
Here's a symbol list of 97 chart and candlestick patterns (13 "investment grade" candle patterns) found in today's securities using my version of Patternz: ANF, ADTN, AJRD, ALKS, ABC, AON, ANET, BBBY, BKNG, BBW, CPB, CNP, CENX, CHS, CIEN, CNO, CMCO, ED, CAG, CW, DECK, DSGR, BOOM, EXC, EXPI, XOM, FICO, FAST, FISV, FMC, GILD, GS, GGG, GFF, GES, HLIT, HE, HSIC, HNI, HUBG, IIIN, PODD, ITGR, INTU, ISRG, JKHY, JNJ, LLY, RAMP, LOW, MTRN, NFG, NOV, NEE, NXGN, NI, NUS, PKI, PNW, R, SCHW, SMG, SIGI, SHOP, SLGN, STR, LUV, TDOC, TPX, TEVA, TMO, TOL, TDG, RIG, UGI, UPS, V, WU, WMB, WSM, WSC, IYZ, IGV, EWT. Click this link for details (pattern type, start and end dates).
For a list of small patterns (those a few days wide) click this link.
-- Thomas Bulkowski
![]()
$ $ $
I show another slider trading quiz featuring Transocean: RIG stock.
$ $ $
Here's a symbol list of 118 chart and candlestick patterns (13 "investment grade" candle patterns) found in today's securities using my version of Patternz: DDD, AJRD, ALB, AMGN, AON, APA, BIG, BIO, CALM, CPB, CNC, CHS, CHD, CI, CMTL, CAG, COP, CW, XRAY, DVN, DSGR, BOOM, EIX, XOM, FIS, FIVN, GME, GPS, GIS, GNW, GILD, GES, HTLD, HSIC, HOV, INFN, INTC, IVC, IRM, K, KBAL, LLY, RAMP, MU, MS, ^IXIC, NTAP, NWL, NXGN, NTNX, ON, PANW, PKE, PDCO, PG, QCOM, REGN, ROG, R, CRM, SCHW, SMG, SMTC, NOW, SHOP, SLGN, STR, SKX, LUV, SWX, TDC, TEVA, TREX, UHAL, VLO, V, VC, WOLF, WWW, ZBRA, QTEC, FXL, FXI, IYZ, IGV, SOXX, SLV, IEO, EEM, EWH, EWY, EWD, EWT, TUR, ROBO, IXN, XRT, UNG, USO, SMH. Click this link for details (pattern type, start and end dates).
For a list of small patterns (those a few days wide) click this link.
$ $ $
The following table shows where Fibonacci retrace values of the day's high-low range are plus pivot points, calculated on the Dow industrials, sorted by value. When several are near each other (small differences), the area might act as support or resistance.
-- Thomas Bulkowski
![]()
| © 2023 ThePatternSite.com Metric | Value | Diff | Close (within 10% of the high-low range for the day)? |
| Monthly S2 | 31,746.21 | ||
| Weekly S2 | 32,295.11 | 548.90 | |
| Monthly S1 | 32,687.89 | 392.77 | |
| Weekly S1 | 32,962.34 | 274.45 | |
| Daily S2 | 33,109.60 | 147.27 | |
| Low | 33,316.25 | 206.65 | |
| Daily S1 | 33,369.58 | 53.33 | |
| Open | 33,439.56 | 69.98 | |
| 61.8% Down from Intraday High | 33,494.50 | 54.95 | |
| Monthly Pivot | 33,515.10 | 20.60 | Yes! The Monthly Pivot is close to the 61.8% Down from Intraday High. |
| 50% Down from Intraday High | 33,549.57 | 34.46 | Yes! The 50% Down from Intraday High is close to the Monthly Pivot. |
| Daily Pivot | 33,576.23 | 26.66 | Yes! The Daily Pivot is close to the 50% Down from Intraday High. |
| 38.2% Down from Intraday High | 33,604.63 | 28.40 | Yes! The 38.2% Down from Intraday High is close to the Daily Pivot. |
| Weekly Pivot | 33,616.15 | 11.52 | Yes! The Weekly Pivot is close to the 38.2% Down from Intraday High. |
| Close | 33,629.56 | 13.41 | Yes! The Close is close to the Weekly Pivot. |
| High | 33,782.88 | 153.32 | |
| Daily R1 | 33,836.21 | 53.33 | |
| Daily R2 | 34,042.86 | 206.65 | |
| Weekly R1 | 34,283.38 | 240.52 | |
| Monthly R1 | 34,456.78 | 173.40 | |
| Weekly R2 | 34,937.19 | 480.41 | |
| Monthly R2 | 35,283.99 | 346.80 |
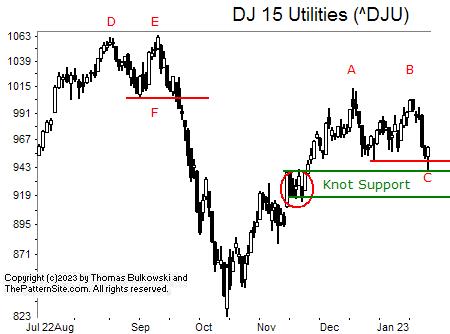
This is a chart of the Dow utilities on the daily scale.
At DEF, we see a double top. A double top is just like it sounds. It's a twin peak pattern with the two tops at about the same price. It confirms as a valid chart pattern when the index closes below the bottom of the valley between the two peaks. That happens at F
AB are two peaks (not as level as DE, but they are close) but in this case, it doesn't confirm yet. At C, the price bar doesn't close below the red line, so it's just squiggles on a price chart (while waiting for confirmation).
How far will price drop? We don't know but a clue is the knot below the double bottom. I would expect the index to reverse between the two green lines but that's just a guess.
![]()
The following is a brief review of how the markets performed over time. The numbers refer to the close-to-close move in the Dow industrials.
No options expire this week.
![]()
The following is based on an SFO article in December 2004 by John Seekinger, titled, "Take a two-dimensional approach." He offers these tips.
| Index | S2 | S1 | Pivot | R1 | R2 |
| Dow Industrials (^DJI): Daily | 32,802 | 33,089 | 33,235 | 33,522 | 33,668 |
| Weekly | 32,210 | 32,793 | 33,531 | 34,114 | 34,853 |
| Monthly | 31,662 | 32,519 | 33,430 | 34,287 | 35,199 |
| S&P500 (^GSPC): Daily | 3,873 | 3,923 | 3,948 | 3,998 | 4,023 |
| Weekly | 3,828 | 3,900 | 3,958 | 4,030 | 4,088 |
| Monthly | 3,667 | 3,820 | 3,917 | 4,071 | 4,168 |
| Nasdaq (^IXIC): Daily | 10,799 | 10,970 | 11,056 | 11,227 | 11,314 |
| Weekly | 10,637 | 10,889 | 11,056 | 11,308 | 11,475 |
| Monthly | 9,841 | 10,491 | 10,857 | 11,507 | 11,873 |
Here are the formulas:
![]()
Earnings season is either underway or should be starting soon. The sessions could be more volatile.
Here's a symbol list of 118 chart and candlestick patterns (13 "investment grade" candle patterns) found in today's securities using my version of Patternz: ADTN, AEIS, AFL, AEE, AEP, AFG, APA, APOG, ACGL, ADM, BKH, BA, BRKR, BG, CALM, CPB, CI, CINF, CLNE, CNA, CGNX, CAG, COST, CROX, CSGS, CW, DSGR, EL, RE, EVRG, EXC, FFIV, FICO, FARO, FDX, FISV, GNW, GILD, GOOGL, GGG, GFF, HURC, IDA, JBLU, JNJ, LRCX, LDOS, LLY, RAMP, LMT, L, MTSI, MANH, MRTN, MTRX, META, MGEE, MLI, NFLX, NEU, OLN, OMC, ON, PANW, PKE, PKI, POR, PPG, PPL, PEG, RTX, ROG, RES, R, SMG, SIGI, NOW, STR, SO, SR, SCS, SSYS, SRDX, SNPS, TEVA, TZOO, VC, WRB, WEX, WMB, WOLF, FXI, SOXX, SLV, EEM, EWH, EWM, EWY, TUR, PPA, PEJ, USO, SMH. Click this link for details (pattern type, start and end dates).
For a list of small patterns (those a few days wide) click this link.
The below industries were the best (rank 1) or worst performing of those I follow.
|
-- Thomas Bulkowski
![]()
$ $ $
Here's a symbol list of 192 chart and candlestick patterns (13 "investment grade" candle patterns) found in today's securities using my version of Patternz: AMD, AJRD, AKAM, AA, ALL, AEP, AXP, AFG, AMWD, APH, AON, APA, ARW, AGO, ADSK, BMI, BCPC, BIIB, BFH, BCO, BRKR, CACI, CALM, CAL, CPB, CNP, CHS, CINF, CLNE, CNA, CMTL, CAG, CR, CRH, CSGS, CW, DVN, DFS, ^DJI, EMN, EBAY, EME, EMR, EL, EVRG, EXC, EXPD, FFIV, FE, GE, GIS, GILD, GPN, GFS, GOOGL, GGG, GFF, THG, HLIT, HIG, HE, HL, HNI, HON, HWM, IDA, IBP, ITGR, IBKR, JAZZ, KALU, LH, LRCX, LAMR, LANC, LDOS, LEN, RAMP, MANH, MAN, MRO, MAS, MTRN, META, MGEE, MSFT, MLKN, MOS, ^IXIC, NOV, NWL, NEE, NXGN, NKE, JWN, NWPX, OXY, OMC, PANW, PETS, PFE, POR, PPG, PG, PEG, KWR, RTX, RCKY, RES, R, SCHW, SMG, SEIC, SRE, NOW, SHW, SHOP, STR, SO, SPSC, SCS, SSYS, SUM, SRDX, TRGP, TDOC, TEVA, TXT, TWLO, SLCA, UNM, VLO, VEEV, VRSN, VMC, WAT, WEX, WMB, ITA, IAI, ITB, DDM, FTEC, FDN, QTEC, FXL, BOTZ, QQQ, ICF, IYZ, IGV, SOXX, IYF, ECH, EWH, EWW, QLD, IBB, PPA, DBA, PEJ, IEV, IXN, XLP, XLF, XRT, XAR, XLK, UNG, USO, MGK. Click this link for details (pattern type, start and end dates).
For a list of small patterns (those a few days wide) click this link.
$ $ $
You can find setups based on a Fibonacci retrace by clicking on the link.
The following patterns were found manually, not using Patternz. Mr. Bulkowski has excluded any securities he owns from appearing in the list. However, he may add any of the securities listed to his portfolio at any time, just as you can.
In the table below, the red and green colors are based on the historical breakout direction for the associated chart pattern. If a high and tight flag appears, the start and end dates highlight the flagpole only and not the flag.
For details about the chart patterns, click here.
-- Thomas Bulkowski
![]()
| Symbol | Chart Pattern | Bullish Bearish | Start | End | Industry |
| ANIK | Pipe bottom | 12/19/2022 | 12/27/2022 | Biotechnology | |
| CPB | Head-and-shoulders top | 12/14/2022 | 01/06/2023 | Food Processing | |
| CLS | Double Bottom, Adam and Adam | 12/07/2022 | 12/22/2022 | Electronics | |
| CNP | Broadening top, right-angled and descending | 11/30/2022 | 01/13/2023 | Electric Utility (Central) | |
| CTAS | Head-and-shoulders top | 11/30/2022 | 12/21/2022 | Industrial Services | |
| CSCO | Double Top, Adam and Adam | 12/01/2022 | 12/13/2022 | Computers and Peripherals | |
| EMR | Double Top, Adam and Eve | 12/14/2022 | 01/09/2023 | Computers and Peripherals | |
| FDS | Double Bottom, Eve and Adam | 12/22/2022 | 01/05/2023 | Information Services | |
| FTNT | Broadening bottom | 12/27/2022 | 01/18/2023 | Computer Software and Svcs | |
| GD | Roof | 10/24/2022 | 01/12/2023 | Aerospace/Defense | |
| HE | Head-and-shoulders top | 12/28/2022 | 01/13/2023 | Electric Utility (West) | |
| HURC | Cup with handle | 07/25/2022 | 01/11/2023 | Machinery | |
| ITGR | Pipe bottom | 12/12/2022 | 12/19/2022 | Electronics | |
| IBKR | Pipe bottom | 12/12/2022 | 12/19/2022 | Securities Brokerage | |
| NOC | Double Top, Eve and Eve | 12/02/2022 | 01/03/2023 | Aerospace/Defense | |
| OXY | Broadening bottom | 12/16/2022 | 01/09/2023 | Petroleum (Producing) | |
| PCG | Double Top, Adam and Eve | 12/14/2022 | 12/28/2022 | Electric Utility (West) | |
| POR | Multi-peaks | 11/29/2022 | 01/12/2023 | Electric Utility (West) | |
| PG | Triple top | 12/14/2022 | 01/09/2023 | Household Products | |
| R | Pipe top | 11/21/2022 | 11/28/2022 | Trucking/Transp. Leasing | |
| SCI | Broadening top, right-angled and descending | 11/08/2022 | 01/12/2023 | Industrial Services | |
| SHOP | Pipe bottom | 12/19/2022 | 12/27/2022 | E-Commerce | |
| SCCO | Diamond top | 12/01/2022 | 12/29/2022 | Metals and Mining (Div.) | |
| SR | Double Bottom, Adam and Adam | 12/05/2022 | 12/16/2022 | Natural Gas (Distributor) | |
| SRDX | Dead-cat bounce | 01/19/2023 | 01/19/2023 | Medical Supplies | |
| TMO | Double Bottom, Adam and Adam | 12/20/2022 | 01/06/2023 | Precision Instrument | |
| MGK | Double Bottom, Adam and Adam | 12/28/2022 | 01/06/2023 | None |
![]()
Since I post this the night before, check how the futures are trading before market open. Large moves can affect the opening direction.
$ $ $
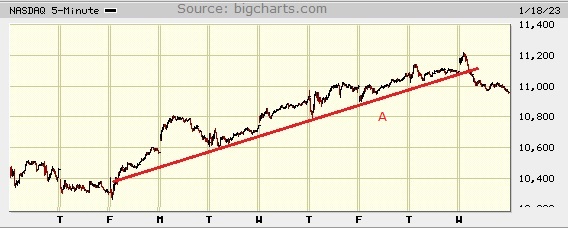
I show a picture of the Nasdaq composite on the 5-minute scale.
I don't have a lot to say about what you see in the chart. The index followed an upward trend, shown here by the red line.
On Wednesday, the index pierced the uptrend by tumbling on good news about inflation moderating but Fed officials sounded a cautious note. The words pulled the rug out from under the inflation news and the markets tumbled. The tumble pushed the chart pattern indicator (not shown) into bearish territory, so this retrace might have legs...or not.
$ $ $
Here's a symbol list of 252 chart and candlestick patterns (13 "investment grade" candle patterns) found in today's securities using my version of Patternz: MMM, ACIW, ADTN, AMD, AJRD, AKAM, ALK, AA, ALKS, DOX, AEE, AEO, AEP, AEL, AMWD, AME, AMGN, AMN, APH, AR, APA, ARW, ADSK, AVA, BMI, BCPC, BSET, BIIB, BKNG, BFH, BCO, BRKR, BBW, BLDR, CBT, CACI, CALM, CPB, CNP, CENX, CVX, CHS, CI, CSCO, CLNE, CLX, CNX, CMTL, CR, CRH, DHR, ^DJT, DRQ, DUK, BOOM, EBAY, EMR, WIRE, EOG, EL, RE, EXPD, XOM, FFIV, FAST, FDX, FE, FIVN, FMC, FORM, FTNT, GPS, GD, GE, GIS, GILD, GPN, GFS, GPRO, GFF, THG, HLIT, HP, HON, HWM, HURC, INFN, NSP, INTC, TILE, IVC, JNJ, KALU, K, KELYA, KMT, LH, LRCX, LAMR, LDOS, LEN, L, M, MANH, MRK, MGEE, MSFT, MLKN, MOS, MYGN, ^IXIC, NOV, NJR, NWL, NEE, NXGN, NI, JWN, NUS, OMCL, OMC, OTEX, OMI, PKG, PANW, PTEN, PETS, PFE, PPL, PINC, PG, PGR, RMBS, RJF, RCKY, ROG, ROL, ROP, R, SLB, SCHW, SMG, SEIC, SIGI, SRE, SCI, SHW, SHOP, STR, LUV, SWX, SCS, SSYS, SUM, TRGP, TDOC, TFX, TDC, TEVA, TMO, TSCO, TG, TWLO, SLCA, UGI, UNH, UNM, VLO, VMI, VEEV, VRSN, V, VMC, WAT, WEX, WMB, XEL, ZBRA, IYM, IYK, IYE, ITB, IEZ, IDU, FTEC, FDN, QTEC, FXL, BOTZ, QQQ, ICF, IGV, SOXX, IHI, EWA, EWO, EWC, EEM, EWH, EWM, EWW, EPP, EZA, EWP, EWT, QLD, IBB, PPA, DBA, PEJ, PXJ, IEV, IXN, XLP, XRT, XAR, XLK, XLU, UNG, USO, MGK. Click this link for details (pattern type, start and end dates).
For a list of small patterns (those a few days wide) click this link.
$ $ $
The following table shows where Fibonacci retrace values of the day's high-low range are plus pivot points, calculated on the Nasdaq composite, sorted by value. When several are near each other (small differences), the area might act as support or resistance.
-- Thomas Bulkowski
![]()
| © 2023 ThePatternSite.com Metric | Value | Diff | Close (within 10% of the high-low range for the day)? |
| Monthly S2 | 9,547.87 | ||
| Monthly S1 | 10,252.44 | 704.57 | |
| Weekly S2 | 10,382.45 | 130.01 | |
| Weekly S1 | 10,669.73 | 287.28 | |
| Daily S2 | 10,772.80 | 103.07 | |
| Daily S1 | 10,864.90 | 92.11 | |
| Weekly Pivot | 10,876.87 | 11.97 | Yes! The Weekly Pivot is close to the Daily S1. |
| Monthly Pivot | 10,912.04 | 35.17 | |
| Low | 10,952.05 | 40.01 | |
| Close | 10,957.01 | 4.96 | Yes! The Close is close to the Low. |
| Daily Pivot | 11,044.16 | 87.15 | |
| 61.8% Down from Intraday High | 11,055.71 | 11.55 | Yes! The 61.8% Down from Intraday High is close to the Daily Pivot. |
| 50% Down from Intraday High | 11,087.73 | 32.02 | |
| 38.2% Down from Intraday High | 11,119.75 | 32.02 | |
| Daily R1 | 11,136.26 | 16.51 | Yes! The Daily R1 is close to the 38.2% Down from Intraday High. |
| Weekly R1 | 11,164.15 | 27.89 | |
| Open | 11,170.95 | 6.80 | Yes! The Open is close to the Weekly R1. |
| High | 11,223.41 | 52.46 | |
| Daily R2 | 11,315.52 | 92.11 | |
| Weekly R2 | 11,371.29 | 55.77 | |
| Monthly R1 | 11,616.61 | 245.32 | |
| Monthly R2 | 12,276.21 | 659.60 |
This is a picture of the chart pattern indicator on the daily scale. The indicator is the line chart below a chart of the S&P 500 composite.
The CPI shows a neutral reading as the off-white vertical bar on the far right of the chart shows.
Notice that the CPI line, the thin blue line near the bottom of the chart, took a big plunge. The white bar and the shape of the CPI line can change for up to a week.
The sharp drop is concerning if it continues. It suggests a retrace will occur but we won't know that for sure until it happens.
The red line is the percentage of stocks at least 20% below their 1-year high (plotted upside down). The blue line is the average percentage drop of stocks below their 1-year high (plotted upside down).
On Tuesday, 41% of stocks in my database are in bear market territory (down at least 20% from their 1-year high).A week ago, it was 47%.The fewest was 35% on 02/09/2022.And the most was 80% on 06/17/2022.
The 505 stocks in my database are down an average of 20% from their yearly high.A week ago, the average was 23%.The peak was 17% on 01/18/2022.And the bottom was 34% on 09/30/2022.
Price obscures the blue line so look at the thin red one. Over the last 2 weeks or so, the line has climbed steeply. The strength of the move higher is startling. Look at the index over the same span.
The index climbed but not nearly as quickly as the red line. It makes me wonder.
Both charts make me cautious. Indeed, I'm waiting for the Nasdaq to retrace so I can buy one more security to complete my portfolio rebalancing.
$ $ $
Here's a symbol list of 136 chart and candlestick patterns (13 "investment grade" candle patterns) found in today's securities using my version of Patternz: MMM, ANF, ADBE, ADTN, AEIS, APD, ALB, ABC, AME, AMGN, APA, ANET, BMI, BCPC, BSET, BBBY, BCO, BRKR, BBW, CBT, CDNS, CVX, CHS, CHD, CINF, CSCO, CLX, CNO, CL, ED, COTY, CR, CMI, DTE, DUK, EBAY, WIRE, EQT, RE, EXPI, XOM, FAST, FMC, FDP, GPS, GNW, GPN, GPRO, THG, HP, HON, HOV, HUM, INFN, NSP, INTC, TILE, ISRG, JNJ, K, KELYA, KMT, KMB, LHX, LH, LLY, L, LXU, MRTN, MCO, MS, MOS, MYGN, NJR, NEE, NI, NOC, NVDA, PKG, PKE, PDCO, PFE, PNW, PGR, RGS, ROL, ROP, SEE, SIGI, SCI, SLGN, LUV, SCS, TPR, TFX, TEVA, TSCO, TDG, TG, UNH, VLO, VMI, VRTX, V, WRB, WOLF, WWD, IYM, IYC, IYE, FXL, BOTZ, SOXX, EWA, EWC, EIS, EWJ, EWM, EWL, EWT, TUR, IBB, PPA, IEV, XLU. Click this link for details (pattern type, start and end dates).
For a list of small patterns (those a few days wide) click this link.
-- Thomas Bulkowski
![]()
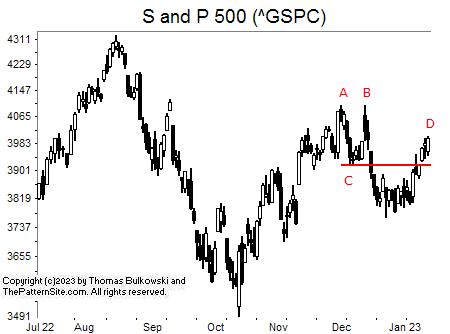
I show the S&P 500 index on the daily scale.
At AB, we have a chart pattern called a double top which predicts a downward breakout. That happens when the index closes below the red line. I drew the red line connecting the lowest valley between the two peaks (C), to the right.
After the index dropped, it quickly reversed and pulled back to the breakout price and kept moving up in this case, to D.
With earnings season about to start, we'll see volatility increase and I would expect a retrace of the move from the December low to D.
![]()
The following is a brief review of how the markets performed over time. The numbers refer to the close-to-close move in the Dow industrials.
Many options expire this week, so traders will be looking to close out their positions, and that suggests increased volatility (large daily price swings).
![]()
The following is based on an SFO article in December 2004 by John Seekinger, titled, "Take a two-dimensional approach." He offers these tips.
| Index | S2 | S1 | Pivot | R1 | R2 |
| Dow Industrials (^DJI): Daily | 33,760 | 34,031 | 34,187 | 34,458 | 34,614 |
| Weekly | 33,102 | 33,702 | 34,022 | 34,623 | 34,943 |
| Monthly | 31,724 | 33,013 | 33,863 | 35,152 | 36,002 |
| S&P500 (^GSPC): Daily | 3,927 | 3,963 | 3,984 | 4,019 | 4,040 |
| Weekly | 3,833 | 3,916 | 3,960 | 4,043 | 4,087 |
| Monthly | 3,618 | 3,809 | 3,955 | 4,145 | 4,291 |
| Nasdaq (^IXIC): Daily | 10,837 | 10,958 | 11,021 | 11,142 | 11,205 |
| Weekly | 10,423 | 10,751 | 10,918 | 11,246 | 11,412 |
| Monthly | 9,589 | 10,334 | 10,953 | 11,698 | 12,317 |
Here are the formulas:
![]()
Earnings season will be starting in about 0 days.
Here's a symbol list of 159 chart and candlestick patterns (13 "investment grade" candle patterns) found in today's securities using my version of Patternz: ABT, ANF, AXDX, AES, AFL, ALB, AMZN, AAPL, ATR, ARW, ASH, ADP, AVY, AVNT, AXS, BECN, BZH, BBBY, BOOT, BRKR, CDNS, CNP, CNO, CGNX, CMTL, ED, COST, CR, CMI, DSGR, DRQ, DTE, DUK, EXP, ELV, EL, RE, EXPI, FDS, FARO, FE, FIVN, FTNT, FTV, GPS, GNW, GOOGL, GPRO, GGG, HSC, HQY, HL, HOV, HUM, IDA, NSP, IBP, ITGR, IVC, NVTA, KELYA, KMT, KEYS, KFRC, KMB, KLAC, KSS, LAMR, LEG, LDOS, LMT, L, MANH, MTRN, MTRX, MDT, MU, MCO, MS, MLI, MUR, MYGN, NFLX, NTAP, NKE, NOC, NOVT, NVDA, ORI, ASGN, ON, OMI, OXM, PANW, PKE, PATK, PETS, PFE, POR, PRU, PEG, RTX, RGS, RHI, ROG, ROL, ROST, SAIC, SMTC, SHW, SHOP, LUV, SWX, SR, SXI, SUM, TGT, TECH, TPX, TER, TEVA, TMO, TDG, TRV, TZOO, TG, TREX, MDRX, VC, WOLF, IAI, IYC, IDU, FXL, BOTZ, IYH, SLV, IHI, EEM, EWL, IBB, PBE, PJP, PHO, ROBO, XLY, XLF, GLD, XHB, UNG. Click this link for details (pattern type, start and end dates).
For a list of small patterns (those a few days wide) click this link.
The below industries were the best (rank 1) or worst performing of those I follow.
|
-- Thomas Bulkowski
![]()
$ $ $
Here's a symbol list of 144 chart and candlestick patterns (13 "investment grade" candle patterns) found in today's securities using my version of Patternz: ANF, ABM, ACN, AYI, ADTN, AJRD, ATSG, ALB, ALKS, AEE, ABC, AMN, AMAT, AIZ, AGO, ADSK, BBBY, BBY, BMRN, BRC, BFH, BRKR, CPB, CX, CHD, CIEN, CLF, CNO, CNX, CMTL, ED, CXW, CR, DSGR, ^DJU, DTE, DUK, BOOM, ECL, RE, EXPI, XOM, FMC, GPS, GD, GPRO, HBI, THG, HSIC, HSY, HOLX, HOV, IEX, INFN, IIIN, TILE, KBAL, LEG, LDOS, LNC, LOW, MAS, MU, MCO, MS, MYGN, ^IXIC, NUS, NVDA, PKE, PDCO, PETS, PFE, POR, PPG, PINC, PEG, RGS, ROK, ROG, ^GSPC, SLB, SKX, SKYW, LUV, SXI, TRGP, TFX, TEVA, TXN, TDG, TG, UGI, UNH, VECO, VEEV, V, VMC, WMT, WOLF, ZBRA, IAI, ITB, IDU, QTEC, FXL, BOTZ, QQQ, IYZ, SLV, EWO, ECH, EEM, EIS, EWJ, EWM, EZA, EWP, QLD, IBB, DBA, PBE, PEJ, PXJ, ROBO, IXC, XLF, MGK. Click this link for details (pattern type, start and end dates).
For a list of small patterns (those a few days wide) click this link.
$ $ $
You can find setups based on a Fibonacci retrace by clicking on the link.
The following patterns were found manually, not using Patternz. Mr. Bulkowski has excluded any securities he owns from appearing in the list. However, he may add any of the securities listed to his portfolio at any time, just as you can.
In the table below, the red and green colors are based on the historical breakout direction for the associated chart pattern. If a high and tight flag appears, the start and end dates highlight the flagpole only and not the flag.
For details about the chart patterns, click here.
-- Thomas Bulkowski
![]()
| Symbol | Chart Pattern | Bullish Bearish | Start | End | Industry |
| ALRM | Double Bottom, Adam and Adam | 12/28/2022 | 01/06/2023 | Computer Software and Svcs | |
| ALB | Pipe bottom | 12/27/2022 | 01/03/2023 | Chemical (Diversified) | |
| ALGT | Ugly double bottom | 10/12/2022 | 11/03/2022 | Air Transport | |
| ATR | Three Rising Valleys | 10/13/2022 | 11/30/2022 | Packaging and Container | |
| BOOT | Ugly double bottom | 11/03/2022 | 12/20/2022 | Shoe | |
| CACI | Double Top, Adam and Adam | 12/02/2022 | 01/06/2023 | IT Services | |
| CAL | Pipe bottom | 12/12/2022 | 12/19/2022 | Shoe | |
| CE | Three Rising Valleys | 10/13/2022 | 12/22/2022 | Chemical (Basic) | |
| CENX | Head-and-shoulders bottom | 07/06/2022 | 12/19/2022 | Metals and Mining (Div.) | |
| CLF | Pipe bottom | 12/12/2022 | 12/19/2022 | Metals and Mining (Div.) | |
| CL | Double Top, Adam and Adam | 12/28/2022 | 01/06/2023 | Household Products | |
| CXW | Pipe top | 11/28/2022 | 12/05/2022 | Industrial Services | |
| DECK | Three Rising Valleys | 09/30/2022 | 12/20/2022 | Shoe | |
| ^DJT | Double Bottom, Adam and Eve | 12/22/2022 | 12/30/2022 | None | |
| EZPW | Double Bottom, Adam and Eve | 12/12/2022 | 12/28/2022 | Financial Services | |
| FRD | Pipe bottom | 12/05/2022 | 12/12/2022 | Building Materials | |
| HTLD | Triple bottom | 12/20/2022 | 01/05/2023 | Trucking/Transp. Leasing | |
| HL | Double Bottom, Eve and Adam | 07/06/2022 | 09/26/2022 | Metals and Mining (Div.) | |
| HOV | Pipe bottom | 12/27/2022 | 01/03/2023 | Homebuilding | |
| IDA | Triangle, symmetrical | 12/13/2022 | 01/12/2023 | Electric Utility (West) | |
| ISRG | Head-and-shoulders top | 12/01/2022 | 01/09/2023 | Medical Supplies | |
| JKHY | Double Bottom, Eve and Eve | 12/20/2022 | 01/05/2023 | IT Services | |
| JNJ | Double Top, Adam and Adam | 12/14/2022 | 01/06/2023 | Medical Supplies | |
| LAMR | Head-and-shoulders bottom | 12/07/2022 | 01/03/2023 | Advertising | |
| MRO | Broadening wedge, descending | 12/13/2022 | 01/09/2023 | Petroleum (Integrated) | |
| MYGN | Pipe bottom | 12/27/2022 | 01/03/2023 | Biotechnology | |
| NBR | Pipe bottom | 12/05/2022 | 12/12/2022 | Oilfield Svcs/Equipment | |
| NWL | Triple bottom | 11/03/2022 | 12/22/2022 | Household Products | |
| NOVT | Triple top | 11/15/2022 | 12/02/2022 | Precision Instrument | |
| NVDA | Pipe bottom | 12/27/2022 | 01/03/2023 | Semiconductor | |
| ON | Double Bottom, Adam and Adam | 12/28/2022 | 01/05/2023 | Semiconductor | |
| QTWO | Pipe bottom | 12/19/2022 | 12/27/2022 | E-Commerce | |
| RJF | Double Bottom, Eve and Eve | 12/19/2022 | 01/05/2023 | Securities Brokerage | |
| ROG | Ugly double bottom | 11/21/2022 | 12/22/2022 | Electronics | |
| RES | Pipe bottom | 12/05/2022 | 12/12/2022 | Oilfield Svcs/Equipment | |
| CRM | Double Bottom, Adam and Eve | 12/08/2022 | 12/22/2022 | E-Commerce | |
| SLB | Pipe bottom | 12/05/2022 | 12/12/2022 | Oilfield Svcs/Equipment | |
| SLGN | Triangle, descending | 11/30/2022 | 01/12/2023 | Packaging and Container | |
| SKYW | Pipe bottom | 12/19/2022 | 12/27/2022 | Air Transport | |
| SCCO | Three Rising Valleys | 09/26/2022 | 12/19/2022 | Metals and Mining (Div.) | |
| LUV | Pipe bottom | 12/27/2022 | 01/03/2023 | Air Transport | |
| SPLK | Ugly double bottom | 10/13/2022 | 11/04/2022 | E-Commerce | |
| SPSC | Three Rising Valleys | 05/18/2022 | 07/14/2022 | E-Commerce | |
| SXI | Pipe bottom | 12/12/2022 | 12/19/2022 | Diversified Co. | |
| TFX | Double Top, Adam and Eve | 12/13/2022 | 01/10/2023 | Diversified Co. | |
| TKR | Head-and-shoulders bottom | 12/07/2022 | 01/03/2023 | Metal Fabricating | |
| TWLO | Dead-cat bounce | 11/04/2022 | 11/04/2022 | E-Commerce | |
| WSM | Triple bottom | 12/06/2022 | 01/03/2023 | Retail (Special Lines) | |
| WOLF | Pipe bottom | 12/27/2022 | 01/03/2023 | Semiconductor | |
| XLK | Double Bottom, Adam and Adam | 12/28/2022 | 01/06/2023 | IT Services |
![]()
Since I post this the night before, check how the futures are trading before market open. Large moves can affect the opening direction.
$ $ $
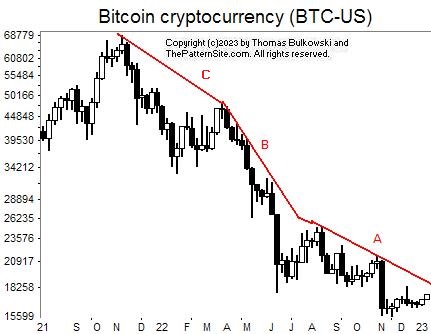
I show a picture of the cryptocurrency Bitcoin on the weekly scale.
I drew a red line, composed of short segments joined together. The first one, C, has a good slope, but not nearly as steep as the one that followed, B. Trend B has more touches than the prior line (which had only 2).
Line C isn't a trendline at all because of only two touches. Indeed, I didn't focus on drawing a typical trendline, but rather just connecting peaks to see how it shows the trend.
Line A suggests that for bitcoin to change trend, it has to close above segment A. That's the big take-away of this chart.
$ $ $
Here's a symbol list of 208 chart and candlestick patterns (13 "investment grade" candle patterns) found in today's securities using my version of Patternz: ANF, AYI, ADTN, APD, ALK, ALB, AMZN, DOX, AMED, AEO, AEP, AEL, AXP, AFG, ABC, APH, AR, ARW, AGO, ADP, AZTA, BZH, BBBY, BBY, BIG, BIO, BKH, BAH, BRKR, BLDR, CALM, CNP, CRL, CIEN, CLNE, CMTL, COTY, CR, CRH, CROX, XRAY, DDS, ^DJT, DTE, EMN, EBAY, ECL, ELV, EME, EPAM, RE, EXC, EXPI, FDS, FARO, FAST, FDX, GME, GPS, IT, GE, GNW, GOOGL, GPRO, HBI, HLIT, HL, HD, DHI, HOV, HURC, ITW, INCY, NSP, IBP, IIIN, TILE, IVC, NVTA, JKHY, KBH, KMT, KLAC, LHX, LZB, LH, LAMR, LEG, LDOS, LOW, MHO, MTSI, MCHX, MLM, MCO, MLI, MYGN, ^IXIC, NCR, NWL, NXGN, NUS, NVDA, OGE, OUT, PTEN, PETS, PFE, POR, PINC, PFG, PHM, KWR, REGN, RGS, ROK, ROG, RES, R, ^GSPC, SRE, SHW, SLGN, SCCO, LUV, SXI, SSYS, SNPS, TFX, TMO, TKR, TOL, TDG, TG, TREX, UHAL, SLCA, UGI, UNM, VLO, MDRX, WSO, WU, WLK, WSM, WOLF, XEL, IYM, IAI, IYC, ITB, IDU, FTEC, BOTZ, QQQ, ICF, IYZ, IYF, IHI, EWA, EWK, EEM, EWQ, EWG, EIS, EWI, EPP, EWD, TUR, QLD, DBA, PEJ, PXJ, ROBO, IEV, ILF, SSO, MXI, XLY, XLF, XHB, XLB, XRT, SPY, XAR, UNG, VIS, VAW, MGK. Click this link for details (pattern type, start and end dates).
For a list of small patterns (those a few days wide) click this link.
$ $ $
The following table shows where Fibonacci retrace values of the day's high-low range are plus pivot points, calculated on the Nasdaq composite, sorted by value. When several are near each other (small differences), the area might act as support or resistance.
-- Thomas Bulkowski
![]()
| © 2023 ThePatternSite.com Metric | Value | Diff | Close (within 10% of the high-low range for the day)? |
| Monthly S2 | 9,539.42 | ||
| Monthly S1 | 10,235.55 | 696.12 | |
| Weekly S2 | 10,255.24 | 19.69 | |
| Weekly S1 | 10,593.45 | 338.22 | |
| Weekly Pivot | 10,603.26 | 9.80 | Yes! The Weekly Pivot is close to the Weekly S1. |
| Daily S2 | 10,705.90 | 102.65 | |
| Low | 10,762.73 | 56.83 | |
| Open | 10,794.99 | 32.26 | |
| Daily S1 | 10,818.79 | 23.80 | |
| 61.8% Down from Intraday High | 10,827.56 | 8.77 | Yes! The 61.8% Down from Intraday High is close to the Daily S1. |
| 50% Down from Intraday High | 10,847.58 | 20.03 | |
| 38.2% Down from Intraday High | 10,867.61 | 20.03 | |
| Daily Pivot | 10,875.61 | 8.00 | Yes! The Daily Pivot is close to the 38.2% Down from Intraday High. |
| Monthly Pivot | 10,903.59 | 27.98 | |
| Close | 10,931.67 | 28.08 | |
| High | 10,932.44 | 0.77 | Yes! The High is close to the Close. |
| Weekly R1 | 10,941.47 | 9.03 | Yes! The Weekly R1 is close to the High. |
| Weekly R2 | 10,951.28 | 9.80 | Yes! The Weekly R2 is close to the Weekly R1. |
| Daily R1 | 10,988.50 | 37.22 | |
| Daily R2 | 11,045.32 | 56.83 | |
| Monthly R1 | 11,599.72 | 554.39 | |
| Monthly R2 | 12,267.76 | 668.05 |
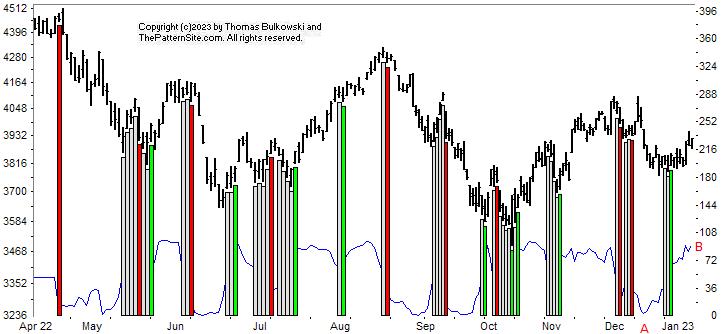
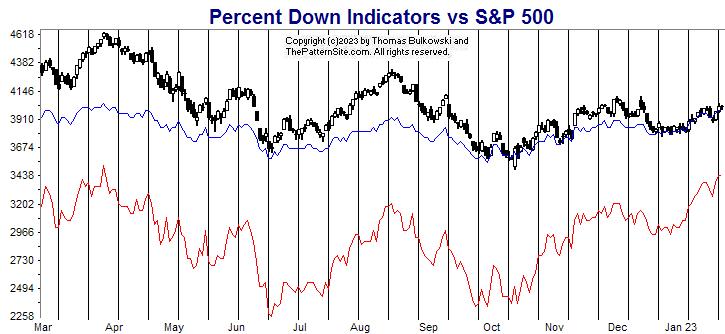
This is a picture of the chart pattern indicator on the daily scale. The indicator is the line chart below a chart of the S&P 500 composite.
The indicator has flipped to bullish (green) as the vertical green bar on the far right of the chart shows. As the index made a descending scallop pattern, the CPI climbed from A to B.
With the CPI so high, it suggests a retrace will come soon. That's also confirmed by the chart pattern, where the right lip is well below the left one.
The red line is the percentage of stocks at least 20% below their 1-year high (plotted upside down). The blue line is the average percentage drop of stocks below their 1-year high (plotted upside down).
On Tuesday, 45% of stocks in my database are in bear market territory (down at least 20% from their 1-year high).A week ago, it was 54%.The fewest was 28% on 01/11/2022.And the most was 80% on 06/17/2022.
The 505 stocks in my database are down an average of 22% from their yearly high.A week ago, the average was 26%.The peak was 15% on 01/11/2022.And the bottom was 34% on 09/30/2022.
Both the red and blue lines made progress this week compared to last week. However, look at the red line. It has climbed substantially over the past week or so.
It suggests there's strength in the move.
Although both charts are bullish, the prior one suggests caution, that the up move is overextended. So I'm cautious also. I expect a retrace to begin shortly.
$ $ $
Here's a symbol list of 136 chart and candlestick patterns (13 "investment grade" candle patterns) found in today's securities using my version of Patternz: ATSG, ALB, ALGT, AIG, AMN, ANIK, AVNT, AZTA, BMI, BECN, BBBY, BRC, BFH, BRKR, CACI, CENX, CF, CHKP, CINF, CTAS, CONN, GLW, CSGS, XRAY, DFS, BOOM, EMN, EBAY, EXPI, FIS, FLEX, FORM, FTV, GPS, IT, GOOGL, GPRO, HBI, HAYN, HSIC, HSY, HD, HOV, IDXX, ITW, IIIN, INTC, IPAR, IVC, JBLU, KBH, KELYA, KMT, KBAL, KSS, LDOS, LEN, LNC, RAMP, MHO, MTSI, MAN, MTRX, MDC, META, MU, MCO, MS, MOS, MYGN, NCR, NFLX, NTAP, NEU, NWPX, NVDA, OUT, OMI, PDCO, PFE, QTWO, QCOM, RL, RMBS, RGS, ROK, ROG, SHOP, STR, SKYW, LUV, SR, SSYS, SRDX, TDOC, TXN, TOL, TDG, TREX, TWLO, V, WSC, WOLF, WWD, IYC, ITB, BOTZ, QQQ, EWQ, EWY, TUR, QLD, IBB, DBA, PBE, PEJ, PXJ, PJP, PHO, IEV, SSO, MXI, XHB, SPY, VIS. Click this link for details (pattern type, start and end dates).
For a list of small patterns (those a few days wide) click this link.
-- Thomas Bulkowski
![]()
$ $ $
I show another slider trading quiz featuring Torchmark: TMK (support and resistance) stock.
$ $ $
For those who have read or downloaded the spreadsheet according to my Retirement article, I flubbed the Excel sheet so I'm reworking the article. I should have it done sometime on Tuesday 1/10.
$ $ $
Here's a symbol list of 205 chart and candlestick patterns (13 "investment grade" candle patterns) found in today's securities using my version of Patternz: DDD, ABM, ADBE, ADTN, AEIS, A, APD, AKAM, ALK, ALGT, AEO, AIG, AMGN, APH, ANIK, ATR, ARCB, ARW, AGO, AZTA, BALL, BAX, BZH, BBBY, BIIB, BMRN, BOOT, BAH, BSX, BFH, BMY, BRKR, BBW, CACI, CLS, CX, CNC, CHKP, CNA, CNO, CMTL, CONN, CXW, CR, CSGS, CW, DECK, DFS, DSGR, ELV, EMR, EQT, XOM, FORM, FCX, FDP, FRD, GD, GPRO, HBI, HP, HSIC, DHI, HUM, INCY, INFN, NSP, INTC, JBLU, KALU, KELYA, KSS, KLIC, LHX, LLY, L, LOW, MAN, MRO, MRTN, MAS, MA, MDC, MRK, MYGN, NOV, NCR, NWL, NXGN, NOC, NUS, ON, PTEN, PFE, PLXS, PGR, QTWO, DGX, RL, RJF, RTX, ROK, CRM, SLB, SEE, SHOP, SLGN, SKYW, SCCO, SXI, SCS, SSYS, SUM, TRGP, TER, TXN, TXT, TDG, TG, TREX, TWLO, VECO, V, WAT, ITA, IYM, IAI, IEZ, IHE, FXI, BOTZ, IHF, IYZ, EWO, EWK, EWC, EEM, EWQ, EWG, EIS, EWI, EWM, EWW, EPP, EWS, EZA, EWY, EWD, EWL, EWT, THD, EWU, IBB, PPA, DBA, PBE, PEJ, PXJ, PJP, ROBO, IEV, SSO, MXI, XLF, XLV, XLB, XAR, VHT, VAW. Click this link for details (pattern type, start and end dates).
For a list of small patterns (those a few days wide) click this link.
$ $ $
The following table shows where Fibonacci retrace values of the day's high-low range are plus pivot points, calculated on the Dow industrials, sorted by value. When several are near each other (small differences), the area might act as support or resistance.
-- Thomas Bulkowski
![]()
| © 2023 ThePatternSite.com Metric | Value | Diff | Close (within 10% of the high-low range for the day)? |
| Monthly S2 | 31,462.27 | ||
| Weekly S2 | 32,448.55 | 986.28 | |
| Monthly S1 | 32,489.96 | 41.41 | Yes! The Monthly S1 is close to the Weekly S2. |
| Weekly S1 | 32,983.10 | 493.14 | |
| Daily S2 | 33,199.36 | 216.25 | |
| Weekly Pivot | 33,346.88 | 147.52 | |
| Daily S1 | 33,358.50 | 11.63 | Yes! The Daily S1 is close to the Weekly Pivot. |
| Low | 33,487.66 | 129.16 | |
| Close | 33,517.65 | 29.99 | Yes! The Close is close to the Low. |
| Monthly Pivot | 33,601.12 | 83.47 | |
| Daily Pivot | 33,646.81 | 45.69 | |
| 61.8% Down from Intraday High | 33,658.59 | 11.78 | Yes! The 61.8% Down from Intraday High is close to the Daily Pivot. |
| Open | 33,664.39 | 5.80 | Yes! The Open is close to the 61.8% Down from Intraday High. |
| 50% Down from Intraday High | 33,711.39 | 47.00 | |
| 38.2% Down from Intraday High | 33,764.18 | 52.80 | |
| Daily R1 | 33,805.95 | 41.77 | Yes! The Daily R1 is close to the 38.2% Down from Intraday High. |
| Weekly R1 | 33,881.43 | 75.48 | |
| High | 33,935.11 | 53.68 | |
| Daily R2 | 34,094.26 | 159.15 | |
| Weekly R2 | 34,245.21 | 150.95 | |
| Monthly R1 | 34,628.81 | 383.60 | |
| Monthly R2 | 35,739.97 | 1,111.16 |
I completed new research on "serious" bear markets (drops of 30% or more) and found that stocks take that size hit once every 2 years, ETFs do it once every 3 years, and mutual funds once every 7.5 years. Read the article (link) for more information.
$ $ $
I looked back at a post 3 weeks ago and found that my prediction was right about the Dow turning up at support. I got one right!
$ $ $
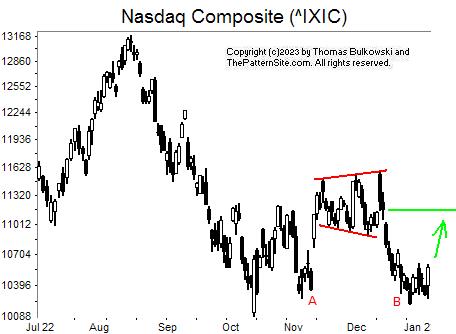
I show the Nasdaq on the daily scale in the chart.
The red lines encompass a chart pattern called a broadening top. Notice how price enters the pattern with a strong upward run, from A. The index forms the broadening top as it decides which direction to move, and with a downward breakout, it returns the index back to the launch price (A).
This move (a return to the launch price, or A = B) is unusual for two reasons.
First, it rarely works, but when it does, it provides a handy target to plan a move.
Second, when it does work, price often stops the decline to B above the low posted at the launch price, A. In other words B > A (but not by much).
This strength suggests the index will rise in the coming week...at least that's my guess.
![]()
The following is a brief review of how the markets performed over time. The numbers refer to the close-to-close move in the Dow industrials.
No options expire this week.
![]()
The following is based on an SFO article in December 2004 by John Seekinger, titled, "Take a two-dimensional approach." He offers these tips.
| Index | S2 | S1 | Pivot | R1 | R2 |
| Dow Industrials (^DJI): Daily | 32,733 | 33,182 | 33,446 | 33,895 | 34,159 |
| Weekly | 32,486 | 33,058 | 33,385 | 33,957 | 34,283 |
| Monthly | 31,500 | 32,565 | 33,639 | 34,704 | 35,778 |
| S&P500 (^GSPC): Daily | 3,774 | 3,834 | 3,870 | 3,931 | 3,967 |
| Weekly | 3,753 | 3,824 | 3,865 | 3,936 | 3,977 |
| Monthly | 3,584 | 3,739 | 3,920 | 4,076 | 4,257 |
| Nasdaq (^IXIC): Daily | 10,140 | 10,355 | 10,479 | 10,694 | 10,819 |
| Weekly | 10,134 | 10,352 | 10,482 | 10,700 | 10,830 |
| Monthly | 9,419 | 9,994 | 10,783 | 11,358 | 12,147 |
Here are the formulas:
![]()
Earnings season will be starting in about 7 days.
Here's a symbol list of 173 chart and candlestick patterns (13 "investment grade" candle patterns) found in today's securities using my version of Patternz: ATSG, AMZN, AMGN, APH, ANIK, APOG, ATR, ACGL, ATO, ADSK, ADP, AVNT, BCPC, BBBY, BERY, BBY, BIO, BAH, BSX, BRC, BLDR, CACI, CE, CX, CNP, CENX, CINF, CLF, CLX, CNA, CNO, CTSH, GLW, COST, CR, CTS, CMI, DHR, ^DJU, ^DJT, DRQ, EXP, EMN, ECL, EL, FLS, FORM, FCX, FRD, GIS, GPN, GL, GES, THG, HSC, HIG, HAYN, HL, HP, DHI, HWM, HUN, ITW, ILMN, INCY, INFN, INTC, IPG, IVC, JBLU, KBH, KMT, KBAL, KSS, LAMR, LMT, L, MAN, MTRN, MDC, MRK, MGEE, MLI, NWL, NEU, JWN, NOC, NUS, ORI, OMC, ON, PKG, PATK, PNW, PPG, PGR, RL, RJF, RGS, RGA, RNG, RLI, ROST, SEE, SMTC, SKX, SCCO, SR, SUM, SRDX, TGT, TXT, TOL, TDG, TRV, TG, TREX, SLCA, UNM, V, WMT, WAT, WERN, WSM, WDAY, ZBRA, ITA, IYM, IYK, IDU, FTEC, FXI, IYZ, EWO, EWK, EWZ, EEM, EIS, EWS, EWY, EWP, EWL, EWT, THD, PPA, DBA, PEJ, PXJ, IXN, ILF, MXI, XLY, XLP, XLF, XLI, XLB, XAR, XLK, VIS, VAW, MGK. Click this link for details (pattern type, start and end dates).
For a list of small patterns (those a few days wide) click this link.
The below industries were the best (rank 1) or worst performing of those I follow.
|
-- Thomas Bulkowski
![]()
$ $ $
Here's a symbol list of 99 chart and candlestick patterns (13 "investment grade" candle patterns) found in today's securities using my version of Patternz: AXDX, ADTN, AEIS, AMZN, ABC, AMN, ANIK, ATR, AIZ, ATO, AVA, BCPC, BALL, BBBY, BAH, CE, CLS, CX, CSCO, CMCO, CMTL, CONN, COP, GLW, CCK, CTS, CMI, EVH, FFIV, FDS, FLS, FORM, FDP, GIS, GL, GOOGL, HSII, DHI, HUBG, ILMN, INCY, INTC, IPI, K, KELYA, KSS, LXU, MRTN, MTRX, MDC, MRK, MGEE, MSFT, MLKN, MOS, NXGN, NWPX, OGE, OMCL, PATK, PFE, PLXS, RGS, RGA, RES, SRDX, TJX, TG, TREX, WRB, WSC, WDAY, IYK, IYE, IDU, FXL, FXI, ICF, EWJ, EWS, TUR, DBA, UNG. Click this link for details (pattern type, start and end dates).
For a list of small patterns (those a few days wide) click this link.
$ $ $
You can find setups based on a Fibonacci retrace by clicking on the link.
The following patterns were found manually, not using Patternz. Mr. Bulkowski has excluded any securities he owns from appearing in the list. However, he may add any of the securities listed to his portfolio at any time, just as you can.
In the table below, the red and green colors are based on the historical breakout direction for the associated chart pattern. If a high and tight flag appears, the start and end dates highlight the flagpole only and not the flag.
For details about the chart patterns, click here.
-- Thomas Bulkowski
![]()
| Symbol | Chart Pattern | Bullish Bearish | Start | End | Industry |
| AFG | Pipe bottom | 12/12/2022 | 12/19/2022 | Insurance (Prop/Casualty) | |
| ABC | Pipe top | 11/28/2022 | 12/05/2022 | Biotechnology | |
| APA | Three Falling Peaks | 11/07/2022 | 12/27/2022 | Petroleum (Producing) | |
| BBBY | Dead-cat bounce | 01/05/2023 | 01/05/2023 | Retail (Special Lines) | |
| CX | Double Bottom, Eve and Eve | 12/16/2022 | 12/30/2022 | Cement and Aggregates | |
| CNC | Double Top, Adam and Adam | 12/01/2022 | 12/08/2022 | Medical Services | |
| CRH | Broadening top | 11/23/2022 | 12/16/2022 | Cement and Aggregates | |
| CTS | Double Bottom, Adam and Adam | 12/16/2022 | 12/22/2022 | Electronics | |
| XRAY | Pipe bottom | 10/31/2022 | 11/07/2022 | Medical Supplies | |
| ^DJU | Head-and-shoulders top | 12/01/2022 | 12/28/2022 | None | |
| HUM | Three Falling Peaks | 11/03/2022 | 12/28/2022 | Medical Services | |
| IIIN | Pipe bottom | 12/12/2022 | 12/19/2022 | Building Materials | |
| PODD | Double Top, Adam and Eve | 11/07/2022 | 12/14/2022 | Medical Supplies | |
| INTC | Pipe bottom | 12/19/2022 | 12/27/2022 | Semiconductor | |
| IPG | Double Bottom, Eve and Eve | 12/09/2022 | 12/19/2022 | Advertising | |
| MCHX | Head-and-shoulders bottom | 12/16/2022 | 12/29/2022 | Advertising | |
| PATK | Triangle, symmetrical | 12/12/2022 | 01/05/2023 | Retail Building Supply | |
| RL | Double Bottom, Adam and Adam | 12/20/2022 | 12/28/2022 | Apparel | |
| SAIA | Double Top, Adam and Adam | 11/15/2022 | 12/13/2022 | Trucking/Transp. Leasing | |
| SCS | Pipe bottom | 12/12/2022 | 12/19/2022 | Furn/Home Furnishings | |
| TREX | Pipe bottom | 12/19/2022 | 12/27/2022 | Building Materials | |
| WAT | Triangle, symmetrical | 11/29/2022 | 01/05/2023 | Precision Instrument | |
| WERN | Double Bottom, Adam and Adam | 12/20/2022 | 12/30/2022 | Trucking/Transp. Leasing | |
| WLK | Double Top, Adam and Adam | 11/11/2022 | 12/13/2022 | Chemical (Basic) |
![]()
Since I post this the night before, check how the futures are trading before market open. Large moves can affect the opening direction.
$ $ $
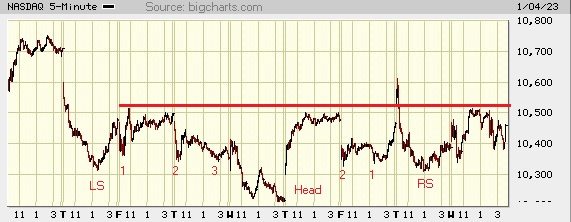
I show a picture of the Nasdaq composite on the 5-minute scale.
What struck me first is the near horizontal move of the index. I drew a horizontal red line to highlight this.
Below that is a complex head-and-shoulders bottom. I highlight the chart pattern by showing the left shoulder (LS), shoulders 1, 2, and 3, mirroring 2, 1, and RS (right shoulder) on the right side of the dual head.
All of this suggests the index will rise in the coming days. First, though, we have to see the index close above the horizontal red line. If that happens, then it'll confirm the chart pattern.
$ $ $
Here's a symbol list of 158 chart and candlestick patterns (13 "investment grade" candle patterns) found in today's securities using my version of Patternz: MMM, ABT, ANF, ACIW, AEIS, AES, ALB, AMZN, AXP, ABC, ANIK, ATR, ASH, ADSK, AVA, BSET, BMRN, BKNG, BSX, BMY, BG, CLS, CX, CSCO, CNO, CMTL, CONN, COST, CRH, CCK, CMI, XRAY, DFS, DSGR, D, DUK, EL, RE, EVRG, EVH, FFIV, FLS, FDP, GE, GNW, GES, HSIC, HNI, HON, HWM, HUBG, HUN, ILMN, INCY, IIIN, INTC, IPI, ISRG, IVC, JNJ, KBH, K, KSS, LEN, L, LOW, M, MRO, MLM, MAS, MSFT, MCO, NCR, NWL, NEU, NKE, ORI, OLN, OMCL, OTEX, OXM, PATK, PYPL, PFE, PINC, PGR, PEG, KWR, QCOM, RGS, RCKY, SAIA, CRM, NOW, SKX, SWX, SR, SSYS, TFX, TEVA, TXN, TSCO, TZOO, TG, TREX, SLCA, VEEV, V, VMC, WRB, WSM, WSC, WDAY, QTEC, FXL, FXI, BOTZ, IYH, IYZ, SOXX, IEO, IHI, EWK, EWZ, ECH, EWQ, EWG, EWH, EWI, EWS, EZA, EWP, EWL, PPA, IEV, XHB, SMH, VHT. Click this link for details (pattern type, start and end dates).
For a list of small patterns (those a few days wide) click this link.
$ $ $
The following table shows where Fibonacci retrace values of the day's high-low range are plus pivot points, calculated on the Nasdaq composite, sorted by value. When several are near each other (small differences), the area might act as support or resistance.
-- Thomas Bulkowski
![]()
| © 2023 ThePatternSite.com Metric | Value | Diff | Close (within 10% of the high-low range for the day)? |
| Monthly S2 | 9,381.79 | ||
| Monthly S1 | 9,920.27 | 538.49 | |
| Weekly S2 | 10,094.83 | 174.55 | |
| Daily S2 | 10,259.63 | 164.80 | |
| Weekly S1 | 10,276.79 | 17.17 | Yes! The Weekly S1 is close to the Daily S2. |
| Low | 10,337.64 | 60.85 | |
| Daily S1 | 10,359.19 | 21.55 | |
| Weekly Pivot | 10,389.44 | 30.24 | |
| 61.8% Down from Intraday High | 10,405.48 | 16.04 | Yes! The 61.8% Down from Intraday High is close to the Weekly Pivot. |
| 50% Down from Intraday High | 10,426.43 | 20.95 | |
| Daily Pivot | 10,437.21 | 10.78 | Yes! The Daily Pivot is close to the 50% Down from Intraday High. |
| 38.2% Down from Intraday High | 10,447.38 | 10.18 | Yes! The 38.2% Down from Intraday High is close to the Daily Pivot. |
| Close | 10,458.76 | 11.38 | Yes! The Close is close to the 38.2% Down from Intraday High. |
| Open | 10,467.82 | 9.06 | Yes! The Open is close to the Close. |
| High | 10,515.22 | 47.40 | |
| Daily R1 | 10,536.77 | 21.55 | |
| Weekly R1 | 10,571.40 | 34.63 | |
| Daily R2 | 10,614.79 | 43.38 | |
| Weekly R2 | 10,684.05 | 69.26 | |
| Monthly Pivot | 10,745.96 | 61.91 | |
| Monthly R1 | 11,284.44 | 538.49 | |
| Monthly R2 | 12,110.13 | 825.68 |
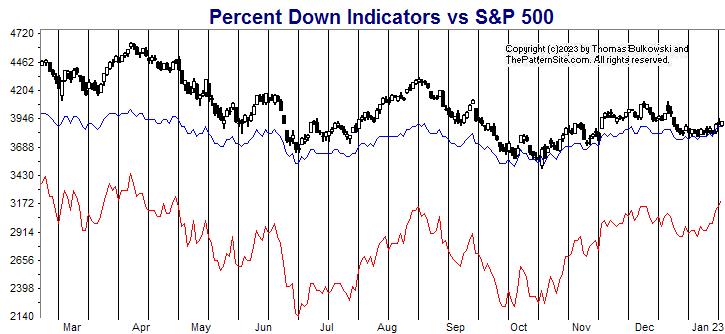
This is a picture of the chart pattern indicator on the daily scale. The indicator is the line chart below a chart of the S&P 500 composite.
The chart shows a transition from neutral to bullish and back to neutral. The signals can change for up to a week. Often they will change after the index makes a big move and kicks stocks to begin trending.
To me, this looks like the index is going to move higher in the coming days. Even though the signal is neutral, I remain bullish for the short term.
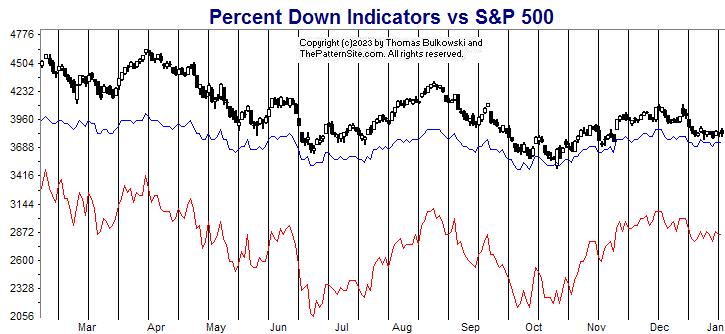
The red line is the percentage of stocks at least 20% below their 1-year high (plotted upside down). The blue line is the average percentage drop of stocks below their 1-year high (plotted upside down).
On Tuesday, 54% of stocks in my database are in bear market territory (down at least 20% from their 1-year high).A week ago, it was 53%.The fewest was 23% on 01/04/2022.And the most was 79% on 06/17/2022.
The 469 stocks in my database are down an average of 25% from their yearly high.A week ago, the average was 25%.The peak was 13% on 01/04/2022.And the bottom was 34% on 09/30/2022.
The red line is worse off than it was a week ago. The blue line, the less volatile of the two lines, shows no change.
Both lines appear to be moving sideways. Although the downtrend can continue and it might look like a measured move down, to me it shows strength.
Look back in June where we see the inverted image of what we see this past week. There, we see price rise, go horizontal and then drop. I expect the same now (except inverted). A down move, a horizontal move (both of which are in place), followed by a rise. Call this the January effect.
$ $ $
Here's a symbol list of 139 chart and candlestick patterns (13 "investment grade" candle patterns) found in today's securities using my version of Patternz: ABT, ANF, AXDX, AES, AFL, ALK, ALB, ALL, AEE, AEL, AFG, ABC, APOG, AAPL, AWI, AGO, AVNT, AVA, BBBY, BA, BSX, BG, CBT, CDNS, CLS, CNC, CLNE, CMTL, COST, CCK, DECK, XRAY, EBAY, EFX, EQT, EL, EVH, FICO, FTNT, FRD, GME, GNW, GFS, GFF, HL, HUBG, INFN, PODD, IPG, IPI, IVC, JAZZ, KBH, KFRC, KSS, KLIC, LAMR, LANC, L, MTSI, M, MRO, MCHX, MRTN, META, NCR, NEE, NKE, JWN, NOC, NWPX, NVDA, OMC, OTEX, OUT, OMI, OXM, PANW, PYPL, PINC, KWR, QCOM, RMBS, REGN, RGS, RCKY, CRM, SCHW, SMTC, SCCO, LUV, TPR, TGT, TDOC, TXN, TKR, TSCO, VEEV, VRSN, WLK, WSC, WOLF, FXI, EWA, EWO, EWK, EWZ, EWG, EWI, EWW, EZA, EWD, EWL, THD, TUR, IBB, SSO, GLD, XLB, XLK, UNG, VHT. Click this link for details (pattern type, start and end dates).
For a list of small patterns (those a few days wide) click this link.
-- Thomas Bulkowski
![]()
$ $ $
Here's the updated 2023 forecast, presented in slider format.
Based on sector performance from Fidelity, the best performing sectors for year-to-date performance as of 12/29/2022 were... (The numbering is how they ranked a month ago.)
The folks at two firms polled by Fidelity weigh the sectors in this order, as of 12/23/22.
Here's how they rank the industries, but only the top 10 appear. One-year change, as of 12/29/22. The numbering is how they ranked a month ago.
$ $ $
Here's a symbol list of 56 chart and candlestick patterns (13 "investment grade" candle patterns) found in today's securities using my version of Patternz: ANF, AXDX, APD, AEE, AEO, AFG, AVA, CBT, CAL, CENX, CLF, CNO, CMCO, ED, CAG, DRQ, DUK, EIX, EVH, GPS, GE, HE, HL, HSII, HELE, HUBG, INCY, IIIN, ITGR, IPAR, IBKR, KMB, LOW, NOC, OXM, PINC, PEG, RL, RGS, SCHW, SXI, SCS, WSC, IYM, EWZ, ECH, THD, PBE, PXJ, ILF, MXI. Click this link for details (pattern type, start and end dates).
For a list of small patterns (those a few days wide) click this link.
$ $ $
The following table shows where Fibonacci retrace values of the day's high-low range are plus pivot points, calculated on the Dow industrials, sorted by value. When several are near each other (small differences), the area might act as support or resistance.
-- Thomas Bulkowski
![]()
| © 2022 ThePatternSite.com Metric | Value | Diff | Close (within 10% of the high-low range for the day)? |
| Monthly S2 | 31,338.80 | ||
| Monthly S1 | 32,243.03 | 904.22 | |
| Weekly S2 | 32,587.70 | 344.67 | |
| Daily S2 | 32,744.48 | 156.78 | |
| Low | 32,847.82 | 103.34 | |
| Weekly S1 | 32,867.47 | 19.65 | Yes! The Weekly S1 is close to the Low. |
| Daily S1 | 32,945.86 | 78.39 | |
| 61.8% Down from Intraday High | 32,964.23 | 18.36 | Yes! The 61.8% Down from Intraday High is close to the Daily S1. |
| 50% Down from Intraday High | 33,000.18 | 35.96 | |
| 38.2% Down from Intraday High | 33,036.14 | 35.96 | |
| Daily Pivot | 33,049.21 | 13.06 | Yes! The Daily Pivot is close to the 38.2% Down from Intraday High. |
| Open | 33,121.61 | 72.40 | |
| Weekly Pivot | 33,127.60 | 5.99 | Yes! The Weekly Pivot is close to the Open. |
| Close | 33,147.25 | 19.65 | Yes! The Close is close to the Weekly Pivot. |
| High | 33,152.55 | 5.30 | Yes! The High is close to the Close. |
| Daily R1 | 33,250.59 | 98.04 | |
| Daily R2 | 33,353.94 | 103.34 | |
| Weekly R1 | 33,407.38 | 53.44 | |
| Monthly Pivot | 33,477.65 | 70.28 | |
| Weekly R2 | 33,667.50 | 189.84 | |
| Monthly R1 | 34,381.88 | 714.38 | |
| Monthly R2 | 35,616.50 | 1,234.63 |
Support this site! Clicking any of the books (below) takes you to
Amazon.com If you buy ANYTHING while there, they pay for the referral.
Legal notice for paid links: "As an Amazon Associate I earn from qualifying purchases."
|
My Stock Market Books
|
My Novels
Orb Foresight Rewrite Coming!
|