
As of 02/26/2026
Indus: 49,499 +17.05 +0.0%
Trans: 19,734 +414.21 +2.1%
Utils: 1,181 -0.24 0.0%
Nasdaq: 22,878 -273.70 -1.2%
S&P 500: 6,909 -37.27 -0.5%
|
YTD
+3.0%
+13.7%
+10.6%
-1.6%
+0.9%
|
|
As of 02/26/2026
Indus: 49,499 +17.05 +0.0%
Trans: 19,734 +414.21 +2.1%
Utils: 1,181 -0.24 0.0%
Nasdaq: 22,878 -273.70 -1.2%
S&P 500: 6,909 -37.27 -0.5%
|
YTD
+3.0%
+13.7%
+10.6%
-1.6%
+0.9%
| |
|
| ||
Since I post this the night before, check how the futures are trading before market open. Large moves can affect the opening direction.
$ $ $
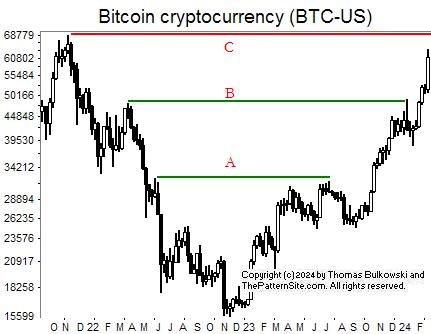
I show a picture of bitcoin (BTC-USD) on the weekly scale.
I drew the red line at the top of the chart (C) to illustrate that the currency has not made a new all-time high. The high was set in late 2021.
The other two lines, A and B, show cup with handle type patterns. They are not a true cup with handle because they are too wide. CWH should be about a year long or narrower.
That applies to stocks, not crypto, so who cares? After the cups finished their handle, they made a nice move higher. If you were to look at the daily chart, you'd see the enthusiasm for the coin pushing it higher. I expect that to continue.
$ $ $
Here's a symbol list of 110 chart and candlestick patterns (13 "investment grade" candle patterns) found in today's securities using my version of Patternz: DDD, ADBE, ADTN, A, AMWD, AMGN, APH, APOG, AGO, BALL, BSET, BG, CPB, CRL, CHKP, CL, CXW, COST, CRH, CTS, DHR, EBAY, EME, EVH, EZPW, FDS, FISV, FCX, IT, GIS, GNW, GILD, GS, GFF, THG, HOLX, ILMN, NSP, INTC, JBLU, KBH, LRCX, LANC, RAMP, MGY, MANH, MCHX, MRK, MU, MS, NTAP, NWPX, NTNX, OLN, PKE, PATK, PINC, PEG, PSTG, REGN, RGLD, R, SBH, SAIC, SEIC, NOW, STR, SXI, TZOO, TREX, UGI, VEEV, VC, WAT, WEX, WPM, WWD, XEL, ITA, IAI, IYC, IYE, IHE, IYH, SLV, IGE, EWH, EWS, EZA, EWP, EWT, THD, EWU, PXJ, PJP, XLY, XLI, UNG, VIS. Click this link for details (pattern type, start and end dates).
For a list of small patterns (those a few days wide) click this link.
$ $ $
The following table shows where Fibonacci retrace values of the day's high-low range are plus pivot points, calculated on the Nasdaq composite, sorted by value. When several are near each other (small differences), the area might act as support or resistance.
-- Thomas Bulkowski
![]()
| © 2024 ThePatternSite.com Metric | Value | Diff | Close (within 10% of the high-low range for the day)? |
| Monthly S2 | 14,676.03 | ||
| Weekly S2 | 15,161.97 | 485.93 | |
| Monthly S1 | 15,311.89 | 149.92 | |
| Weekly S1 | 15,554.85 | 242.97 | |
| Monthly Pivot | 15,723.05 | 168.20 | |
| Weekly Pivot | 15,844.54 | 121.48 | |
| Daily S2 | 15,879.83 | 35.30 | |
| Daily S1 | 15,913.79 | 33.95 | |
| Low | 15,924.72 | 10.93 | |
| Close | 15,947.74 | 23.02 | |
| 61.8% Down from Intraday High | 15,954.84 | 7.10 | Yes! The 61.8% Down from Intraday High is close to the Close. |
| Daily Pivot | 15,958.67 | 3.84 | Yes! The Daily Pivot is close to the 61.8% Down from Intraday High. |
| 50% Down from Intraday High | 15,964.14 | 5.47 | Yes! The 50% Down from Intraday High is close to the Daily Pivot. |
| Open | 15,969.14 | 5.00 | Yes! The Open is close to the 50% Down from Intraday High. |
| 38.2% Down from Intraday High | 15,973.44 | 4.30 | Yes! The 38.2% Down from Intraday High is close to the Open. |
| Daily R1 | 15,992.63 | 19.18 | |
| High | 16,003.56 | 10.93 | |
| Daily R2 | 16,037.51 | 33.95 | |
| Weekly R1 | 16,237.42 | 199.91 | |
| Monthly R1 | 16,358.91 | 121.48 | |
| Weekly R2 | 16,527.11 | 168.20 | |
| Monthly R2 | 16,770.07 | 242.97 |

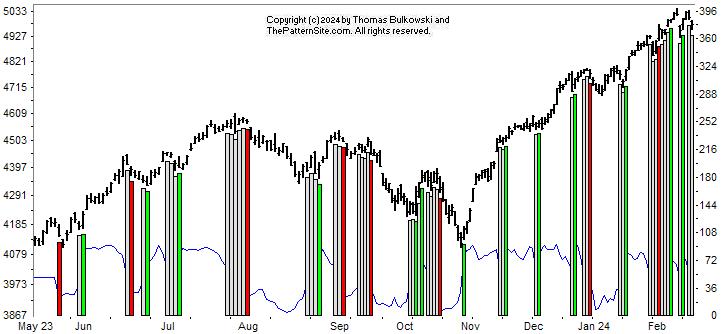
This is a picture of the chart pattern indicator on the daily scale. The indicator is the line chart below a chart of the S&P 500 composite.
I thought a significant retrace was about to happen. I circled the three areas that gave me the clue. Notice that the signals group before the index drops. That's what I thought would happen at A.
Sigh. It didn't. I'm still waiting for a retrace. It's coming. It may not happen in my lifetime, but I do believe it'll happen.
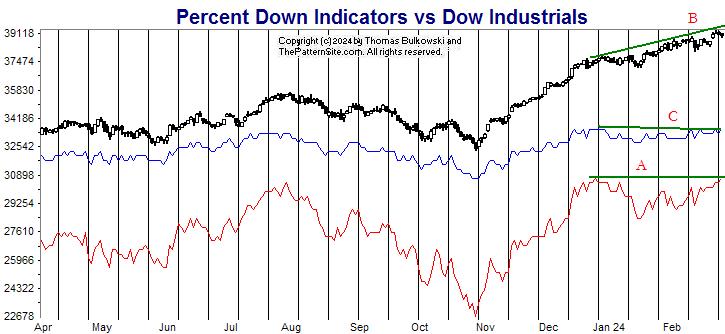
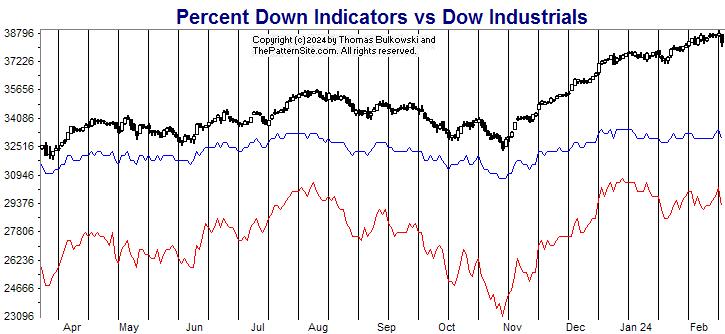
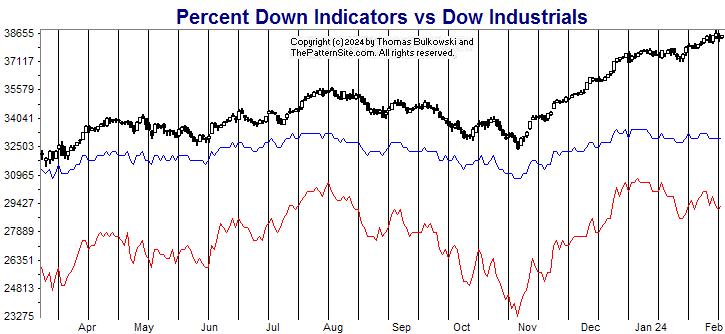
The red line is the percentage of stocks at least 20% below their 1-year high (plotted upside down). The blue line is the average percentage drop of stocks below their 1-year high (plotted upside down).
On Tuesday, 25% of stocks in my database are in bear market territory (down at least 20% from their 1-year high).A week ago, it was 27%.The fewest was 25% on 02/27/2024.And the most was 56% on 10/27/2023.
The 516 stocks in my database are down an average of 14% from their yearly high.A week ago, the average was 15%.The peak was 13% on 12/26/2023.And the bottom was 25% on 10/27/2023.
I drew green lines connecting the two indicators and the index.
Line A is flat (the red line is the more sensitive of the red and blue lines). C tilts downward. And B has a nice rise to it. This spells d-i-v-e-r-g-e-n-c-e to me. Bearish divergence.
However, like the prior chart, there's no telling if it's significant and divergence can continue for months. What I'm saying is that the charts are warning of a downturn, but it's only a warning. Could be a fake warning or it could be wrong with the bullish uptrend continuing.
$ $ $
Here's a symbol list of 134 chart and candlestick patterns (13 "investment grade" candle patterns) found in today's securities using my version of Patternz: DDD, AXDX, ADBE, AEIS, AFL, ALB, AA, AEO, AIG, AMWD, AME, AMGN, APOG, AAPL, ATR, ADP, AVNT, AXS, AZTA, BSET, BECN, BERY, BIO, BIIB, BAH, BSX, BBW, CF, CRL, CI, CLF, CNX, CGNX, CL, CXW, CW, DHR, DRQ, EMN, EQT, EVH, FFIV, FAST, GES, HBI, HLIT, HE, HSII, HP, HON, INFN, NSP, IIIN, TILE, IPI, INTU, IRM, JBLU, KALU, LRCX, LDOS, LNC, MTSI, M, MANH, MAS, META, MU, MLKN, MCO, MOS, MLI, MUR, NFLX, NTAP, NJR, NEU, NI, JWN, NWPX, NOVT, NTNX, OR, OMI, OXM, PKE, PFE, PPG, PINC, QCOM, RL, ROG, R, SBH, SAIC, SMTC, NOW, STR, SXI, TER, TJX, TOL, TDG, RIG, TRV, TREX, UNH, VFC, MDRX, WAT, WEX, WOLF, IYC, IYE, FXI, IAT, IEV, SLV, IGE, EWA, EWO, EWG, EIS, EWM, EWY, DBA, ROBO, XRT, UNG, USO. Click this link for details (pattern type, start and end dates).
For a list of small patterns (those a few days wide) click this link.
-- Thomas Bulkowski
![]()
$ $ $
I show another slider trading quiz featuring symmetrical triangles.
$ $ $
Here's a symbol list of 139 chart and candlestick patterns (13 "investment grade" candle patterns) found in today's securities using my version of Patternz: ABT, ANF, ADTN, AEIS, APD, ALK, AA, DOX, AXP, AMWD, APOG, AAPL, ANET, ATO, ADP, AVNT, BERY, BKNG, BAH, BSX, CACI, CAL, CRL, CI, CTAS, CLX, CNA, CR, CTS, CW, ^DJU, ^DJI, DTE, EXP, EBAY, EIX, ELV, WIRE, EPAM, EFX, EQT, EG, EVRG, EVH, XOM, EZPW, FARO, FIS, FISV, FDP, GME, HBI, HSII, HSY, ILMN, IIIN, IBKR, IPG, INTU, LHX, LOW, LPLA, LXU, MGY, MANH, MA, MRCY, MGEE, MU, MCO, NFLX, NTGR, NJR, NWL, NEE, NWPX, NOVT, OMCL, OMC, OMI, PANW, PCTY, PEN, PETS, POR, PSTG, RL, RJF, RTX, RHI, RCKY, RES, SAIC, SHOP, SKYW, SPSC, TPX, TEVA, TKR, TDG, TZOO, TG, TREX, UHAL, UNH, VECO, WMT, WSO, WSM, WSC, WOLF, XEL, IYC, IDU, SLV, IYF, EWO, EWZ, EWC, EIS, EWI, EWJ, EWW, EWS, EWD, EWL, XLP, XLF, UNG, VHT. Click this link for details (pattern type, start and end dates).
For a list of small patterns (those a few days wide) click this link.
$ $ $
The following table shows where Fibonacci retrace values of the day's high-low range are plus pivot points, calculated on the Dow industrials, sorted by value. When several are near each other (small differences), the area might act as support or resistance.
-- Thomas Bulkowski
![]()
| © 2024 ThePatternSite.com Metric | Value | Diff | Close (within 10% of the high-low range for the day)? |
| Monthly S2 | 36,770.50 | ||
| Monthly S1 | 37,919.87 | 1,149.36 | |
| Weekly S2 | 37,953.00 | 33.13 | |
| Weekly S1 | 38,511.11 | 558.12 | |
| Monthly Pivot | 38,601.07 | 89.96 | |
| Daily S2 | 38,893.55 | 292.48 | |
| Weekly Pivot | 38,896.70 | 3.14 | Yes! The Weekly Pivot is close to the Daily S2. |
| Daily S1 | 38,981.39 | 84.70 | |
| Low | 39,025.80 | 44.41 | |
| Close | 39,069.23 | 43.43 | |
| 61.8% Down from Intraday High | 39,109.88 | 40.64 | |
| Daily Pivot | 39,113.64 | 3.77 | Yes! The Daily Pivot is close to the 61.8% Down from Intraday High. |
| 50% Down from Intraday High | 39,135.84 | 22.20 | |
| Open | 39,144.79 | 8.95 | Yes! The Open is close to the 50% Down from Intraday High. |
| 38.2% Down from Intraday High | 39,161.82 | 17.03 | Yes! The 38.2% Down from Intraday High is close to the Open. |
| Daily R1 | 39,201.48 | 39.66 | |
| High | 39,245.89 | 44.41 | |
| Daily R2 | 39,333.73 | 87.84 | |
| Weekly R1 | 39,454.81 | 121.08 | |
| Monthly R1 | 39,750.44 | 295.63 | |
| Weekly R2 | 39,840.40 | 89.96 | |
| Monthly R2 | 40,431.64 | 591.25 |
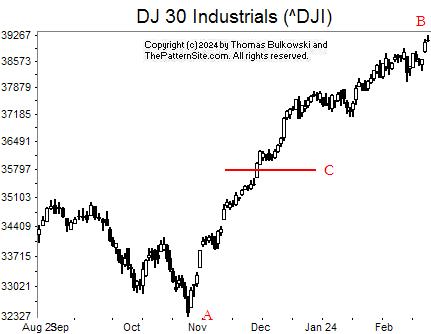
The Dow has been on a tear since point A in late October (or early November). The mid point of the move from A to B, using a ruler, is the red line.
When, not if, the industrials retrace, it's probably going to take the index down far, perhaps to that red line, C (approximately).
I can already see the chart pattern indicator (not shown) getting nervous about the climb, but those fears have lessened in the last few days.
I still think trouble is coming. According to my 2024 Dow forecast, it could be until May before we see a significant decline.
In the meantime, enjoy the ride. And be sure to carry plenty of bottled oxygen for the climb. ![]()
![]()
The following is a brief review of how the markets performed over time. The numbers refer to the close-to-close move in the Dow industrials.
No options expire this week.
![]()
The following is based on an SFO article in December 2004 by John Seekinger, titled, "Take a two-dimensional approach." He offers these tips.
| Index | S2 | S1 | Pivot | R1 | R2 |
| Dow Industrials (^DJI): Daily | 38,981 | 39,057 | 39,169 | 39,244 | 39,357 |
| Weekly | 37,974 | 38,553 | 38,917 | 39,496 | 39,861 |
| Monthly | 36,791 | 37,961 | 38,622 | 39,792 | 40,452 |
| S&P500 (^GSPC): Daily | 5,064 | 5,076 | 5,094 | 5,106 | 5,123 |
| Weekly | 4,884 | 4,986 | 5,049 | 5,151 | 5,214 |
| Monthly | 4,670 | 4,879 | 4,995 | 5,205 | 5,321 |
| Nasdaq (^IXIC): Daily | 15,849 | 15,923 | 16,029 | 16,103 | 16,208 |
| Weekly | 15,178 | 15,588 | 15,861 | 16,270 | 16,543 |
| Monthly | 14,692 | 15,345 | 15,739 | 16,392 | 16,786 |
Here are the formulas:
![]()
Earnings season is either underway or should be starting soon. The sessions could be more volatile.
Here's a symbol list of 134 chart and candlestick patterns (13 "investment grade" candle patterns) found in today's securities using my version of Patternz: AXDX, ACN, AEIS, APD, ALRM, AEP, AEL, AMGN, AAPL, AWI, AGO, BALL, BAX, BECN, BERY, BA, BRC, BCO, BMY, CBT, CDNS, CF, CNA, CNO, CL, CMTL, COST, COTY, CSGS, CTS, DHR, DFS, DSGR, BOOM, EIX, EME, WIRE, EPAM, EVRG, FICO, FARO, FIS, FISV, FTV, FRD, GGG, THG, HLIT, HE, HTLD, HNI, HD, HUM, JBHT, IDXX, IPG, INTU, KBH, KMB, LRCX, LANC, MAN, MCHX, NTGR, NWL, NOC, NWPX, NOVT, OMC, OMI, PAYX, PEN, PINC, PSTG, RGS, RLI, ROP, ROST, RES, CRM, SHOP, STR, SPSC, SXI, SRDX, TECH, TFX, TDC, TER, TXN, TMO, TSCO, TG, UHAL, VC, WAT, WSO, WU, WOLF, IDU, IYH, MXI, SOXX, SLV, IYF, EWK, EWZ, EWC, EWQ, EWI, EWJ, EWW, EWD, PBE, XLF, XHB, XRT, VHT, VIS, VAW. Click this link for details (pattern type, start and end dates).
For a list of small patterns (those a few days wide) click this link.
The below industries were the best (rank 1) or worst performing of those I follow.
|
-- Thomas Bulkowski
![]()
$ $ $
Here's a symbol list of 174 chart and candlestick patterns (13 "investment grade" candle patterns) found in today's securities using my version of Patternz: DDD, AXDX, APD, AKAM, ALK, AYX, AEO, AEL, AME, APH, ADSK, AVY, AVA, BCPC, BZH, BA, BKNG, CDNS, COR, CENX, CF, CRL, CTAS, CNA, CTSH, CL, CSGP, COST, COTY, CRH, CCRN, CTS, D, DTE, EXP, EIX, EME, WIRE, EPAM, EVRG, EXPD, FDS, FICO, FARO, FAST, FDX, FISV, FIVN, GNW, GPRO, GGG, GFF, GES, HBI, HSIC, HOLX, HD, HON, IBP, IPG, ISRG, JBLU, KALU, LZB, LAMR, LEG, MTSI, MCHX, MRTN, MLM, MAS, META, MCO, MLI, NTGR, NWL, NEU, JWN, NWPX, NOVT, OMC, OTEX, PATK, PAYX, PRFT, PFG, PSTG, RMBS, RNG, ROK, ROG, ROP, RGLD, RES, SAIA, SAND, NOW, SHOP, SPLK, SPSC, SXI, SUM, SNPS, TGT, TDOC, TDY, TFX, TXT, TG, TREX, UHAL, UPS, VMI, VECO, VMC, WRB, WSO, WERN, WPM, ZBRA, IYC, IYE, FXL, BOTZ, ICF, IEV, IXC, ILF, SOXX, SLV, IYF, EWA, EWK, EWZ, EWC, EEM, EWQ, EWG, EWI, EWJ, EPP, EWY, EWD, THD, QLD, PHO, ROBO, XLE, XLF, XLI, XLK, VIS, VAW. Click this link for details (pattern type, start and end dates).
For a list of small patterns (those a few days wide) click this link.
$ $ $
You can find setups based on a Fibonacci retrace by clicking on the link.
The following patterns were found manually, not using Patternz. Mr. Bulkowski has excluded any securities he owns from appearing in the list. However, he may add any of the securities listed to his portfolio at any time, just as you can.
In the table below, the red and green colors are based on the historical breakout direction for the associated chart pattern. If a high and tight flag appears, the start and end dates highlight the flagpole only and not the flag.
For details about the chart patterns, click here.
-- Thomas Bulkowski
![]()
| Symbol | Chart Pattern | Bullish Bearish | Start | End | Industry |
| ACIW | Broadening top | 12/15/2023 | 02/15/2024 | IT Services | |
| ALGT | Triangle, ascending | 01/08/2024 | 02/22/2024 | Air Transport | |
| DOX | Double Top, Adam and Adam | 01/22/2024 | 02/07/2024 | IT Services | |
| AMED | Triangle, symmetrical | 02/06/2024 | 02/21/2024 | Medical Services | |
| AMN | Dead-cat bounce | 02/16/2024 | 02/16/2024 | Human Resources | |
| AR | Head-and-shoulders top | 12/27/2023 | 01/30/2024 | Natural Gas (Diversified) | |
| AVA | Pipe bottom | 02/05/2024 | 02/12/2024 | Electric Utility (West) | |
| CNA | Pipe top | 02/05/2024 | 02/12/2024 | Insurance (Prop/Casualty) | |
| CAG | Triple top | 01/04/2024 | 02/02/2024 | Food Processing | |
| CONN | Broadening top, right-angled and descending | 01/08/2024 | 02/22/2024 | Retail (Special Lines) | |
| DFS | Pipe bottom | 01/16/2024 | 01/22/2024 | Financial Services | |
| D | Pipe bottom | 02/05/2024 | 02/12/2024 | Electric Utility (East) | |
| DTE | Double Bottom, Eve and Eve | 01/24/2024 | 02/08/2024 | Electric Utility (Central) | |
| BOOM | Pipe bottom | 01/08/2024 | 01/16/2024 | Metal Fabricating | |
| EBAY | Triple bottom | 01/16/2024 | 02/13/2024 | Internet | |
| EIX | Pipe bottom | 02/05/2024 | 02/12/2024 | Electric Utility (West) | |
| WIRE | Pipe top | 02/05/2024 | 02/12/2024 | Metals and Mining (Div.) | |
| FARO | Double Top, Eve and Adam | 01/30/2024 | 02/12/2024 | Precision Instrument | |
| FIVN | Double Top, Eve and Adam | 01/22/2024 | 02/12/2024 | Computer Software and Svcs | |
| GL | Double Bottom, Eve and Adam | 01/09/2024 | 02/01/2024 | Insurance (Life) | |
| HUN | Double Bottom, Eve and Adam | 01/17/2024 | 02/13/2024 | Chemical (Specialty) | |
| ITW | Double Bottom, Adam and Adam | 02/01/2024 | 02/13/2024 | Metal Fabricating | |
| ITGR | Double Top, Adam and Eve | 01/22/2024 | 02/13/2024 | Electronics | |
| JAZZ | Triple bottom | 02/02/2024 | 02/14/2024 | Biotechnology | |
| K | Double Bottom, Eve and Eve | 01/22/2024 | 02/09/2024 | Food Processing | |
| MTDR | Triple bottom | 12/12/2023 | 02/05/2024 | Petroleum (Producing) | |
| MYGN | Double Bottom, Adam and Adam | 02/05/2024 | 02/13/2024 | Biotechnology | |
| NWPX | Double Top, Adam and Adam | 01/31/2024 | 02/12/2024 | Building Materials | |
| OXY | Double Bottom, Eve and Adam | 01/18/2024 | 02/05/2024 | Petroleum (Producing) | |
| OXM | Double Bottom, Eve and Eve | 01/16/2024 | 02/05/2024 | Apparel | |
| PANW | Dead-cat bounce | 02/21/2024 | 02/21/2024 | Computer Software and Svcs | |
| PPL | Double Bottom, Eve and Eve | 01/24/2024 | 02/08/2024 | Electric Utility (East) | |
| PSTG | Pipe top | 02/05/2024 | 02/12/2024 | Computers and Peripherals | |
| RNG | Head-and-shoulders top | 12/28/2023 | 02/12/2024 | Computer Software and Svcs | |
| ROL | Triangle, ascending | 01/22/2024 | 02/14/2024 | Industrial Services | |
| R | Double Top, Adam and Adam | 12/26/2023 | 02/12/2024 | Trucking/Transp. Leasing | |
| SMTC | Triangle, symmetrical | 01/17/2024 | 02/21/2024 | Semiconductor Cap Equip. | |
| NOW | Pipe top | 02/05/2024 | 02/12/2024 | IT Services | |
| SHOP | Pipe top | 02/05/2024 | 02/12/2024 | E-Commerce | |
| SWX | Double Bottom, Adam and Adam | 02/08/2024 | 02/14/2024 | Natural Gas (Distributor) | |
| SWN | Triple bottom | 01/23/2024 | 02/14/2024 | Natural Gas (Diversified) | |
| TDOC | Dead-cat bounce | 02/21/2024 | 02/21/2024 | Healthcare Information | |
| UIS | Dead-cat bounce | 02/21/2024 | 02/21/2024 | Computers and Peripherals |
![]()
Since I post this the night before, check how the futures are trading before market open. Large moves can affect the opening direction.
$ $ $
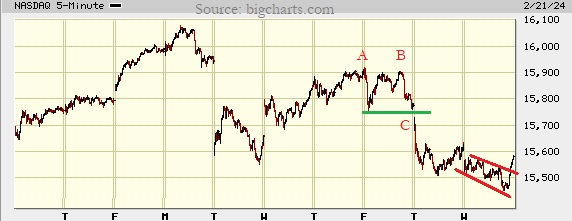
I show a picture of the Nasdaq composite on the 5-minute scale.
Peaks AB show a pattern called a double top (two similar peaks) or even a triple top (three similar peaks). The pattern confirms as valid when the index closes below the green line at C. I drew the line connecting the lowest valley between peaks A and B.
Recently, the index formed a down-sloping channel, which I show here in red. The breakout from the channel was upward, suggesting a higher close will come tomorrow (but the start could be bumpy with a retrace of the strong move up in the last hour of today's session).
$ $ $
Here's a symbol list of 165 chart and candlestick patterns (13 "investment grade" candle patterns) found in today's securities using my version of Patternz: DDD, AEIS, APD, ALKS, AR, ATR, ARCB, ADSK, AVA, AXS, BMI, BA, BFH, BRKR, CDNS, CDAY, CNA, CNX, CL, CCRN, CTS, DHR, XRAY, ^DJI, D, BOOM, EBAY, EIX, WIRE, EPAM, EQT, EG, EVRG, EXC, FICO, FARO, FIS, FTNT, GME, GE, GNW, GES, HBI, HAYN, HOLX, DHI, HUBG, IDA, IBP, ITGR, IPG, JAZZ, KMT, KEYS, LZB, LDOS, LLY, RAMP, MGY, MRO, MCHX, MTRN, META, MCO, MLI, NTGR, NTAP, NWL, NWPX, NOVT, NTNX, NVDA, OMC, OTEX, PANW, PAYX, PRFT, PETS, PFG, PSTG, RRC, RNG, ROP, RGLD, RES, SAIA, SCHW, SAIC, SCI, NOW, SHOP, SLGN, SMAR, LUV, SWN, SPLK, SPSC, SSYS, SUM, SNPS, TPR, TECH, TDOC, TDY, TG, UHAL, SLCA, UIS, WAT, WSO, WERN, WPM, WOLF, WWW, WWD, ITA, IYM, IAI, IYE, IHE, QTEC, FXL, FXI, IEV, IGV, IXC, EWO, EWZ, ECH, EEM, EWQ, EWG, EWH, EIS, EWI, EWP, EWD, EWL, QLD, IBB, PPA, DBA, PBE, XLE, XLB. Click this link for details (pattern type, start and end dates).
For a list of small patterns (those a few days wide) click this link.
$ $ $
The following table shows where Fibonacci retrace values of the day's high-low range are plus pivot points, calculated on the Nasdaq composite, sorted by value. When several are near each other (small differences), the area might act as support or resistance.
-- Thomas Bulkowski
![]()
| © 2024 ThePatternSite.com Metric | Value | Diff | Close (within 10% of the high-low range for the day)? |
| Monthly S2 | 14,081.88 | ||
| Monthly S1 | 14,831.38 | 749.49 | |
| Weekly S2 | 15,208.83 | 377.45 | |
| Weekly S1 | 15,394.85 | 186.02 | |
| Daily S2 | 15,406.70 | 11.85 | Yes! The Daily S2 is close to the Weekly S1. |
| Low | 15,451.65 | 44.95 | |
| Monthly Pivot | 15,455.72 | 4.07 | Yes! The Monthly Pivot is close to the Low. |
| Daily S1 | 15,493.79 | 38.06 | |
| 61.8% Down from Intraday High | 15,502.09 | 8.30 | Yes! The 61.8% Down from Intraday High is close to the Daily S1. |
| 50% Down from Intraday High | 15,517.67 | 15.58 | |
| Open | 15,532.12 | 14.46 | |
| 38.2% Down from Intraday High | 15,533.24 | 1.12 | Yes! The 38.2% Down from Intraday High is close to the Open. |
| Daily Pivot | 15,538.73 | 5.49 | Yes! The Daily Pivot is close to the 38.2% Down from Intraday High. |
| Close | 15,580.87 | 42.14 | |
| High | 15,583.68 | 2.81 | Yes! The High is close to the Close. |
| Daily R1 | 15,625.82 | 42.14 | |
| Daily R2 | 15,670.76 | 44.95 | |
| Weekly Pivot | 15,737.46 | 66.70 | |
| Weekly R1 | 15,923.48 | 186.02 | |
| Monthly R1 | 16,205.22 | 281.74 | |
| Weekly R2 | 16,266.09 | 60.87 | |
| Monthly R2 | 16,829.56 | 563.47 |
This is a picture of the chart pattern indicator on the daily scale. The indicator is the line chart below a chart of the S&P 500 composite.
The chart shows the CPI has entered the neutral zone, not bullish nor bearish. It's transitioning from bullish, so that's a warning that it's getting weaker. It could drop into bearish territory in the coming days or weeks.
However, if you look at the chart, signal changes that come in wide groups (meaning a number of changes in a short time) signal a top. That happened in late July/early August and October. The narrower changes (one to three bars wide), like those in May and June, didn't signal a lasting trend change.
If that analysis is correct, then we're looking at a whopper of a drop coming.
The red line is the percentage of stocks at least 20% below their 1-year high (plotted upside down). The blue line is the average percentage drop of stocks below their 1-year high (plotted upside down).
On Tuesday, 27% of stocks in my database are in bear market territory (down at least 20% from their 1-year high).A week ago, it was 27%.The fewest was 25% on 12/26/2023.And the most was 56% on 10/27/2023.
The 516 stocks in my database are down an average of 15% from their yearly high.A week ago, the average was 14%.The peak was 13% on 12/26/2023.And the bottom was 25% on 10/27/2023.
The blue line is weaker this week compared to a week ago, but the red line (the more sensitive of the two) shows no change.
The prior chart warns of a significant drop coming, but this chart is neutral. I'd like to say that one of them is wrong, but both could be wrong.
$ $ $
Here's a symbol list of 137 chart and candlestick patterns (13 "investment grade" candle patterns) found in today's securities using my version of Patternz: MMM, ADBE, ADTN, ALK, ALB, AYX, AEP, AFG, AMN, AON, AAPL, ACGL, ANET, AWI, AVNT, BRC, BFH, BCO, CNC, CNP, CIEN, CLX, CGNX, CL, CSGP, COST, CR, DFS, EXP, ELV, WIRE, EQT, EXPI, EXPD, FE, FISV, FLEX, GPN, GL, GGG, GES, THG, HL, IDA, PODD, ISRG, IRM, KMB, KSS, LLY, RAMP, MHO, MAN, MU, MYGN, NTGR, NTAP, NWL, OXY, ORI, ORCL, OR, OUT, PAYX, QTWO, QCOM, RNG, RCKY, ROST, CRM, SEE, SEIC, SIGI, SMTC, NOW, SMAR, SWN, TXT, TOL, TRV, TG, UNM, VFC, VLO, VMI, WMT, WERN, WPM, WMB, WOLF, WDAY, IHE, BOTZ, QQQ, IYH, IEV, MXI, IEO, EWO, EWK, EWZ, EEM, EWQ, EWG, EIS, EWI, EWM, EWS, EWD, QLD, XLV, USO, VHT, MGK, VONG. Click this link for details (pattern type, start and end dates).
For a list of small patterns (those a few days wide) click this link.
-- Thomas Bulkowski
![]()
$ $ $
I show another slider trading quiz featuring Pipe tops.
$ $ $
Here's a symbol list of 122 chart and candlestick patterns (13 "investment grade" candle patterns) found in today's securities using my version of Patternz: DDD, DOX, AMN, AMAT, ACGL, BIO, BRKR, CX, COR, CNC, CF, CRL, CIEN, CMTL, COST, CRH, CCRN, CSGS, FANG, BOOM, EXP, EG, EZPW, FDX, FIS, FIVN, FLEX, FLS, FORM, FCX, GOOGL, GGG, GES, THG, HUBG, ITGR, KMB, KLIC, LH, LRCX, LLY, MANH, MRO, MRTN, MA, MU, MOS, ^IXIC, NTAP, ORI, PXD, QCOM, RGA, RNG, RLI, ROL, RES, SAIA, CRM, SAIC, SEIC, SIGI, SMAR, SCCO, SWN, TDOC, TTD, TKR, TDG, TWLO, VLO, VRTX, VMC, WSM, WOLF, WWW, WDAY, IYC, IYE, QTEC, FXI, BOTZ, QQQ, IYZ, IEV, IGV, IXC, MXI, ILF, IYF, EWO, EWC, EEM, EWQ, EWG, EWM, EWS, EZA, EWY, EWD, EWU, QLD, PJP, XLE, XLB, VAW, MGK, VONG. Click this link for details (pattern type, start and end dates).
For a list of small patterns (those a few days wide) click this link.
$ $ $
The following table shows where Fibonacci retrace values of the day's high-low range are plus pivot points, calculated on the Dow industrials, sorted by value. When several are near each other (small differences), the area might act as support or resistance.
-- Thomas Bulkowski
![]()
| © 2024 ThePatternSite.com Metric | Value | Diff | Close (within 10% of the high-low range for the day)? |
| Monthly S2 | 36,421.88 | ||
| Monthly S1 | 37,524.93 | 1,103.06 | |
| Weekly S2 | 37,644.42 | 119.49 | |
| Weekly S1 | 38,136.21 | 491.79 | |
| Monthly Pivot | 38,226.01 | 89.80 | |
| Daily S2 | 38,436.96 | 210.96 | |
| Weekly Pivot | 38,531.64 | 94.68 | |
| Daily S1 | 38,532.48 | 0.83 | Yes! The Daily S1 is close to the Weekly Pivot. |
| Low | 38,583.24 | 50.76 | |
| Close | 38,627.99 | 44.75 | |
| 61.8% Down from Intraday High | 38,675.61 | 47.62 | |
| Daily Pivot | 38,678.75 | 3.15 | Yes! The Daily Pivot is close to the 61.8% Down from Intraday High. |
| 50% Down from Intraday High | 38,704.14 | 25.38 | |
| 38.2% Down from Intraday High | 38,732.67 | 28.53 | |
| Open | 38,751.71 | 19.04 | Yes! The Open is close to the 38.2% Down from Intraday High. |
| Daily R1 | 38,774.27 | 22.55 | Yes! The Daily R1 is close to the Open. |
| High | 38,825.03 | 50.77 | |
| Daily R2 | 38,920.54 | 95.51 | |
| Weekly R1 | 39,023.43 | 102.88 | |
| Monthly R1 | 39,329.06 | 305.64 | |
| Weekly R2 | 39,418.86 | 89.80 | |
| Monthly R2 | 40,030.14 | 611.27 |
$ $ $
Here's a symbol list of 165 chart and candlestick patterns (13 "investment grade" candle patterns) found in today's securities using my version of Patternz: DDD, MMM, AMD, AKAM, ALK, ALKS, AYX, AR, ATR, AVY, AZTA, BMI, BAX, CBT, CDNS, CNC, CF, CRL, CVX, CHD, CR, CRH, CROX, CSGS, CTS, ^DJI, BOOM, EMN, XOM, EZPW, FIS, FISV, FLEX, FLS, FORM, FTV, GPS, GOOGL, GPRO, GGG, HTLD, HELE, HP, HNI, HUBG, HUN, IPI, INTU, JAZZ, KELYA, KLIC, LNC, LMT, LXU, MANH, MAN, MRO, MCHX, MLM, MTRN, MGEE, MLKN, MUR, NBR, NWL, NUS, OUT, PCTY, PEN, PFE, PNW, PXD, QTWO, KWR, QCOM, RJF, ROG, RES, R, SAIA, SBH, SMG, NOW, STR, SMAR, SWN, SPLK, SXI, SCS, SUM, TPR, TDOC, TPX, TDC, TXN, TTD, TSCO, TG, TWLO, SLCA, UIS, VMI, MDRX, VRSN, WERN, WEX, WMB, WOLF, WWW, ZBRA, IYK, IYC, IYE, IEZ, IHE, BOTZ, IHF, IEV, IXC, IGE, IYF, EWA, EWC, EWQ, EWG, EIS, EWI, EWJ, EPP, EWS, EWP, EWD, EWL, TUR, PPA, PXJ, PJP, PHO, XLP, XLE, XLF, XRT, VHT. Click this link for details (pattern type, start and end dates).
For a list of small patterns (those a few days wide) click this link.
$ $ $
You can find setups based on a Fibonacci retrace by clicking on the link.
The following patterns were found manually, not using Patternz. Mr. Bulkowski has excluded any securities he owns from appearing in the list. However, he may add any of the securities listed to his portfolio at any time, just as you can.
In the table below, the red and green colors are based on the historical breakout direction for the associated chart pattern. If a high and tight flag appears, the start and end dates highlight the flagpole only and not the flag.
For details about the chart patterns, click here.
-- Thomas Bulkowski
![]()
| Symbol | Chart Pattern | Bullish Bearish | Start | End | Industry |
| DDD | Pipe bottom | 01/29/2024 | 02/05/2024 | Electronics | |
| APA | Double Bottom, Adam and Adam | 02/05/2024 | 02/13/2024 | Petroleum (Producing) | |
| AVNT | Double Bottom, Adam and Eve | 01/18/2024 | 02/05/2024 | Chemical (Specialty) | |
| BMI | Double Bottom, Adam and Eve | 01/26/2024 | 02/06/2024 | Precision Instrument | |
| BECN | Double Bottom, Eve and Eve | 01/24/2024 | 02/02/2024 | Retail Building Supply | |
| BIG | Dead-cat bounce | 02/12/2024 | 02/12/2024 | Retail Store | |
| BRKR | Triple bottom | 01/03/2024 | 02/12/2024 | Precision Instrument | |
| CNC | Double Bottom, Adam and Adam | 01/25/2024 | 02/06/2024 | Medical Services | |
| CGNX | Double Bottom, Adam and Adam | 02/06/2024 | 02/13/2024 | Precision Instrument | |
| FANG | Double Bottom, Eve and Adam | 01/18/2024 | 02/05/2024 | Petroleum (Producing) | |
| DDS | Triple bottom | 01/05/2024 | 02/07/2024 | Retail Store | |
| EMN | Double Bottom, Adam and Adam | 02/02/2024 | 02/13/2024 | Chemical (Diversified) | |
| FE | Double Bottom, Adam and Eve | 01/25/2024 | 02/08/2024 | Electric Utility (East) | |
| HBI | Broadening top | 01/29/2024 | 02/15/2024 | Apparel | |
| IIIN | Pipe bottom | 01/16/2024 | 01/22/2024 | Building Materials | |
| IPG | Broadening top, right-angled and descending | 12/18/2023 | 02/09/2024 | Advertising | |
| LOW | Double Bottom, Adam and Eve | 01/05/2024 | 01/25/2024 | Retail Building Supply | |
| MA | Pennant | 02/01/2024 | 02/12/2024 | Financial Services | |
| MDT | Double Top, Adam and Adam | 01/12/2024 | 01/31/2024 | Medical Supplies | |
| MLI | Scallop, ascending | 12/27/2023 | 01/30/2024 | Metal Fabricating | |
| NUS | Dead-cat bounce | 02/15/2024 | 02/15/2024 | Toiletries/Cosmetics | |
| ORI | Double Bottom, Adam and Eve | 01/25/2024 | 02/08/2024 | Insurance (Prop/Casualty) | |
| OMI | Head-and-shoulders bottom | 01/03/2024 | 02/05/2024 | Medical Supplies | |
| PTEN | Double Bottom, Adam and Adam | 02/05/2024 | 02/13/2024 | Oilfield Svcs/Equipment | |
| PEN | Scallop, ascending | 01/16/2024 | 02/09/2024 | Medical Supplies | |
| RES | Double Bottom, Adam and Adam | 02/05/2024 | 02/13/2024 | Oilfield Svcs/Equipment | |
| SIGI | Double Bottom, Adam and Adam | 02/01/2024 | 02/08/2024 | Insurance (Prop/Casualty) | |
| SR | Head-and-shoulders bottom | 01/18/2024 | 02/13/2024 | Natural Gas (Distributor) | |
| SPSC | Double Bottom, Adam and Adam | 01/05/2024 | 02/01/2024 | E-Commerce | |
| SCS | Double Bottom, Eve and Eve | 01/18/2024 | 02/05/2024 | Furn/Home Furnishings | |
| TDC | Dead-cat bounce | 02/13/2024 | 02/13/2024 | Computer Software and Svcs | |
| VEEV | Three Rising Valleys | 12/07/2023 | 02/01/2024 | Healthcare Information | |
| VRTX | Broadening top | 01/12/2024 | 01/30/2024 | Biotechnology | |
| ZBRA | Double Bottom, Adam and Adam | 01/17/2024 | 02/01/2024 | Computers and Peripherals |
![]()
Since I post this the night before, check how the futures are trading before market open. Large moves can affect the opening direction.
$ $ $
I show a picture of the Nasdaq composite on the 5-minute scale.
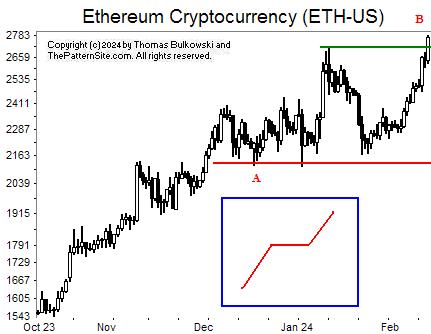
The cryptocurrency Ethereum (ETH-USD) found support at the horizontal red line A. At B, the currency pushed above resistance setup by the prior peak. This might be the end of the upward run, when it forms a 2B patterns (where the second peak sneaks above the first one but then reverses).
My feeling, and it's just a guess, is that the pattern will resemble the red line in the inset.
From the October low, price moved up to A, it's gone horizontal, and then is making another uphill run. So I'm expecting the uphill run to last longer.
$ $ $
Here's a symbol list of 137 chart and candlestick patterns (13 "investment grade" candle patterns) found in today's securities using my version of Patternz: DDD, ATSG, AKAM, AEL, AIG, AME, AON, AAPL, AVA, BALL, BAX, BIIB, BMRN, BR, CPB, CE, CX, CNC, CENX, CRL, CNX, CMCO, CMTL, GLW, CR, CCK, CSGS, CTS, CMI, ^DJT, BOOM, EMR, FDX, FIS, FIVN, FLEX, FORM, FNV, FRD, GE, GNW, GL, GGG, HNI, HWM, HUBG, HUM, HUN, HURC, INFN, NSP, IIIN, IPAR, INTU, JNJ, KEYS, KFRC, KLIC, LLY, MTSI, MAN, MCHX, MLM, MTRN, MTRX, MU, MLKN, MCO, NOV, NFLX, NTAP, NOVT, OMCL, PRFT, PXD, QTWO, KWR, QCOM, RNG, RHI, ROL, R, SMG, SMTC, LUV, SWN, SXI, SCS, SSYS, TPR, TRGP, TDOC, TXN, TMO, TKR, TDG, TRV, TG, WMT, WU, WPM, WWD, IYM, IAI, IEV, IXC, MXI, EWA, EWO, EWC, ECH, EEM, EWI, EWM, EPP, EWS, EZA, EWY, EWP, EWD, EWT, EWU, PJP, XLE, UNG, USO. Click this link for details (pattern type, start and end dates).
For a list of small patterns (those a few days wide) click this link.
$ $ $
The following table shows where Fibonacci retrace values of the day's high-low range are plus pivot points, calculated on the Nasdaq composite, sorted by value. When several are near each other (small differences), the area might act as support or resistance.
-- Thomas Bulkowski
![]()
| © 2024 ThePatternSite.com Metric | Value | Diff | Close (within 10% of the high-low range for the day)? |
| Monthly S2 | 13,918.28 | ||
| Monthly S1 | 14,888.72 | 970.43 | |
| Weekly S2 | 15,243.76 | 355.05 | |
| Monthly Pivot | 15,448.00 | 204.24 | |
| Weekly S1 | 15,551.46 | 103.45 | |
| Daily S2 | 15,621.30 | 69.84 | |
| Low | 15,683.94 | 62.64 | |
| Daily S1 | 15,740.22 | 56.28 | |
| 61.8% Down from Intraday High | 15,753.30 | 13.08 | Yes! The 61.8% Down from Intraday High is close to the Daily S1. |
| 50% Down from Intraday High | 15,774.72 | 21.42 | |
| Weekly Pivot | 15,779.37 | 4.65 | Yes! The Weekly Pivot is close to the 50% Down from Intraday High. |
| Open | 15,781.71 | 2.34 | Yes! The Open is close to the Weekly Pivot. |
| 38.2% Down from Intraday High | 15,796.15 | 14.44 | Yes! The 38.2% Down from Intraday High is close to the Open. |
| Daily Pivot | 15,802.87 | 6.72 | Yes! The Daily Pivot is close to the 38.2% Down from Intraday High. |
| Close | 15,859.15 | 56.28 | |
| High | 15,865.51 | 6.36 | Yes! The High is close to the Close. |
| Daily R1 | 15,921.79 | 56.28 | |
| Daily R2 | 15,984.44 | 62.64 | |
| Weekly R1 | 16,087.07 | 102.63 | |
| Weekly R2 | 16,314.98 | 227.92 | |
| Monthly R1 | 16,418.44 | 103.45 | |
| Monthly R2 | 16,977.72 | 559.29 |
Market dips are beautiful things!
I don't usually discuss my market trading, but I bought some QQQs late in the trading session. I caught the Nasdaq ETF (at $425 and change) before it turned higher going into the close, so I'm pleased. I've been waiting for a retrace to spend some cash, and I finally found it. I expect a snap-back rally tomorrow (2/14). If it doesn't recover, I'm not worried. This is a long-term holding, one I consider a buy-and-hold forever thing.
If you look at the forecast here, this is the drop in February that the chart shows forecasted to be early in February, not midway. Regardless of the timing, I'll take it.
This is a picture of the chart pattern indicator on the daily scale. The indicator is the line chart below a chart of the S&P 500 composite.
The CPI turned bearish today, due to the big sell off on news that inflation was lower than last month, but above predictions. In other words, it was good news but not superb news. As I wrote above, I expect a snap-back rally.
The chart is bearish, but I expect the red bar on the far right of the chart to disappear if we see a big rally. Signals can change for up to a week.
The red line is the percentage of stocks at least 20% below their 1-year high (plotted upside down). The blue line is the average percentage drop of stocks below their 1-year high (plotted upside down).
On Tuesday, 31% of stocks in my database are in bear market territory (down at least 20% from their 1-year high).A week ago, it was 31%.The fewest was 25% on 12/26/2023.And the most was 56% on 10/27/2023.
The 516 stocks in my database are down an average of 16% from their yearly high.A week ago, the average was 16%.The peak was 13% on 12/26/2023.And the bottom was 25% on 10/27/2023.
The red and blue lines show no change from a week ago. So the chart is neutral.
The prior chart says it's bearish, but I don't believe it. This chart is neutral, but has bearish divergence (today's reading is below the December peak and price on the bar chart is much higher today than in December).
I think the markets will make a nice recovery to erase this dip. However, I could be wrong... The Nasdaq forecast says we'll recover going into March but then fade to mid May.
$ $ $
Here's a symbol list of 131 chart and candlestick patterns (13 "investment grade" candle patterns) found in today's securities using my version of Patternz: DDD, MMM, ACIW, AFL, AAPL, ANET, AGO, ATO, ADP, AXS, BAX, BIG, BMRN, BR, CDNS, CPB, CNC, CENX, CHKP, CVX, CTAS, CNA, CNO, CNX, CTSH, ED, CONN, CSGP, CCK, CSGS, CW, BOOM, ECL, EOG, EXPI, EXPD, FDS, FDX, FIVN, FORM, FCX, FRD, GNW, GL, GPRO, HTLD, HL, DHI, HUBG, NSP, IBKR, JBLU, KFRC, KMB, KLIC, LHX, LAMR, LDOS, LLY, RAMP, LMT, LPLA, MCHX, MA, MU, NI, NOC, OLN, OTEX, ORCL, OUT, PETS, PXD, PPG, PGR, QTWO, QCOM, RGS, RGA, RNG, RLI, ROP, RGLD, CRM, SMG, SMTC, SCI, NOW, SHOP, SMAR, SCCO, SPLK, SNPS, TDOC, TDC, TER, TXN, TDG, TG, TWLO, VRSN, WMT, WAT, WPM, WMB, ZBRA, ICF, IGV, IXC, SLV, EWZ, EWG, EIS, EWJ, EWW, EZA, EWL, EWU, PJP, XLE, GLD, UNG. Click this link for details (pattern type, start and end dates).
For a list of small patterns (those a few days wide) click this link.
-- Thomas Bulkowski
![]()
$ $ $
I show another slider trading quiz featuring Flags.
$ $ $
Here's a symbol list of 161 chart and candlestick patterns (13 "investment grade" candle patterns) found in today's securities using my version of Patternz: ANF, ABM, AXDX, AES, ALRM, ALK, AYX, AEE, AEP, AIG, AMWD, APOG, ADM, ANET, ASH, AIZ, BSET, BAX, BIG, BMRN, CACI, CDNS, CE, CNC, CENX, CIEN, CTSH, CMTL, COP, COST, CROX, CSGS, XRAY, FANG, ^DJI, D, ECL, WIRE, EQT, FICO, FIS, FE, FLS, IT, GPN, GL, GS, HIG, HE, HAYN, HELE, HD, HON, IDA, IPAR, JKHY, JBLU, KALU, K, KSS, LZB, LANC, LEN, LNC, L, LOW, LXU, MANH, MCHX, MLM, MTRN, MLKN, MYGN, NTGR, NWL, NEE, JWN, NOC, NWPX, NUS, OGE, OLN, OMC, ASGN, OR, PKE, PLXS, PPG, PINC, PFG, PGR, QTWO, KWR, RJF, RNG, SBH, SLB, SEIC, SCI, NOW, SHOP, LUV, SR, SPLK, SXI, SNPS, TDC, TXN, TTD, TMO, TOL, RIG, VRSN, VMC, WRB, WWW, ITA, IYM, IYC, ITB, IEZ, IHE, DDM, FXL, IYZ, IGV, ILF, SOXX, EEM, EWG, EWH, EWI, EWS, EWY, EWD, TUR, PEJ, PXJ, PJP, XLV, XHB, XLB, XRT, XAR, XLU, USO, VHT, VAW. Click this link for details (pattern type, start and end dates).
For a list of small patterns (those a few days wide) click this link.
$ $ $
The following table shows where Fibonacci retrace values of the day's high-low range are plus pivot points, calculated on the Dow industrials, sorted by value. When several are near each other (small differences), the area might act as support or resistance.
-- Thomas Bulkowski
![]()
| © 2024 ThePatternSite.com Metric | Value | Diff | Close (within 10% of the high-low range for the day)? |
| Monthly S2 | 36,573.98 | ||
| Monthly S1 | 37,685.68 | 1,111.70 | |
| Weekly S2 | 38,055.88 | 370.20 | |
| Monthly Pivot | 38,234.65 | 178.77 | |
| Weekly S1 | 38,426.63 | 191.98 | |
| Daily S2 | 38,486.30 | 59.68 | |
| Weekly Pivot | 38,591.15 | 104.85 | |
| Low | 38,628.92 | 37.77 | |
| Daily S1 | 38,641.84 | 12.92 | Yes! The Daily S1 is close to the Low. |
| Open | 38,656.76 | 14.92 | Yes! The Open is close to the Daily S1. |
| 61.8% Down from Intraday High | 38,742.82 | 86.05 | |
| 50% Down from Intraday High | 38,778.00 | 35.18 | |
| Daily Pivot | 38,784.46 | 6.46 | Yes! The Daily Pivot is close to the 50% Down from Intraday High. |
| Close | 38,797.38 | 12.92 | Yes! The Close is close to the Daily Pivot. |
| 38.2% Down from Intraday High | 38,813.18 | 15.80 | Yes! The 38.2% Down from Intraday High is close to the Close. |
| High | 38,927.08 | 113.89 | |
| Daily R1 | 38,940.00 | 12.92 | Yes! The Daily R1 is close to the High. |
| Weekly R1 | 38,961.91 | 21.91 | Yes! The Weekly R1 is close to the Daily R1. |
| Daily R2 | 39,082.62 | 120.71 | |
| Weekly R2 | 39,126.43 | 43.81 | |
| Monthly R1 | 39,346.35 | 219.92 | |
| Monthly R2 | 39,895.32 | 548.97 |
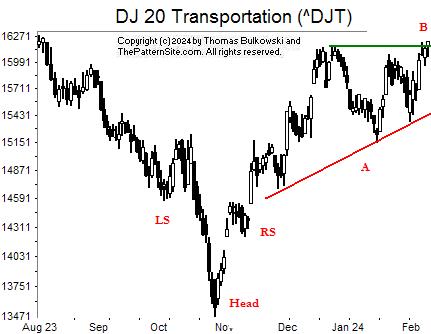
I show the Dow transports on the daily scale, but there's not much to discuss.
I drew red trendline A connecting the recent bottoms. The line supports the index.
The green line I drew because I wanted to show that the index has climbed above it, at B. It has not moved much higher, of course. It could form a 2B top and reverse.
A 2B pattern is when a second peak moves slightly above the first one before reversing. The drop that follows isn't usually significant before a recovery happens.
I think the chart is bullish, so I'm expecting more of an upward move in the coming week.
![]()
The following is a brief review of how the markets performed over time. The numbers refer to the close-to-close move in the Dow industrials.
Many options expire this week, so traders will be looking to close out their positions, and that suggests increased volatility (large daily price swings).
![]()
The following is based on an SFO article in December 2004 by John Seekinger, titled, "Take a two-dimensional approach." He offers these tips.
| Index | S2 | S1 | Pivot | R1 | R2 |
| Dow Industrials (^DJI): Daily | 38,492 | 38,582 | 38,658 | 38,748 | 38,824 |
| Weekly | 38,014 | 38,343 | 38,549 | 38,878 | 39,085 |
| Monthly | 36,532 | 37,602 | 38,193 | 39,263 | 39,853 |
| S&P500 (^GSPC): Daily | 4,989 | 5,008 | 5,019 | 5,038 | 5,049 |
| Weekly | 4,880 | 4,953 | 4,992 | 5,065 | 5,104 |
| Monthly | 4,565 | 4,796 | 4,913 | 5,144 | 5,261 |
| Nasdaq (^IXIC): Daily | 15,768 | 15,879 | 15,943 | 16,055 | 16,119 |
| Weekly | 15,288 | 15,639 | 15,823 | 16,175 | 16,359 |
| Monthly | 13,962 | 14,976 | 15,492 | 16,506 | 17,022 |
Here are the formulas:
![]()
Earnings season is either underway or should be starting soon. The sessions could be more volatile.
Here's a symbol list of 151 chart and candlestick patterns (13 "investment grade" candle patterns) found in today's securities using my version of Patternz: MMM, AXDX, ACIW, ALRM, AA, AYX, AMWD, AMN, APOG, AMAT, AVY, AXS, BSET, BAX, CACI, CDNS, CPB, CENX, CVX, CLNE, CTSH, CL, CAG, CONN, COP, CXW, COST, CRH, CROX, ^DJI, DRQ, ECL, EOG, EFX, EXPD, XOM, EZPW, FFIV, FICO, FARO, FIVN, FLS, FMC, FTV, FNV, FCX, GME, GGG, GES, HELE, HWM, ILMN, IPAR, INTU, KALU, KMT, KSS, LRCX, LEG, LXU, MCHX, MTRN, MTRX, MDC, MDT, META, MSFT, MCO, MYGN, ^IXIC, NTGR, NWPX, NUS, OXY, OLN, OMC, PKE, PEN, PRFT, PETS, PSTG, RNG, RLI, RGLD, R, SAND, SLB, SMG, NOW, LUV, SWX, SPLK, SPSC, SXI, SSYS, TDY, TTD, TJX, TSCO, TDG, RIG, TRV, UIS, VMI, VRSN, VC, WMB, WSM, IYC, IYE, ITB, IEZ, IHE, FTEC, FDN, QTEC, FXL, BOTZ, IYZ, IEV, IGV, IXC, SOXX, IGE, IEO, EIS, EZA, EWY, EWL, PXJ, PJP, ROBO, XLE, XHB, XLK, VAW, MGK, VONG. Click this link for details (pattern type, start and end dates).
For a list of small patterns (those a few days wide) click this link.
The below industries were the best (rank 1) or worst performing of those I follow.
|
-- Thomas Bulkowski
![]()
I released the 2024 forecast for five market indices: Dow industrials, transports, utilities, S&P 500 and Nasdaq.
$ $ $
Here's a symbol list of 140 chart and candlestick patterns (13 "investment grade" candle patterns) found in today's securities using my version of Patternz: DDD, AXDX, ACIW, ALL, AYX, AEP, AIG, AME, AMN, AON, BAX, BERY, BMRN, BKNG, BAH, BG, CACI, CENX, CVX, CNX, CL, ED, CAG, COST, COTY, CCRN, XRAY, DDS, ^DJT, DRQ, EVRG, FDS, FICO, FLEX, FLS, FMC, GILD, GPRO, GGG, GES, HELE, HSIC, HSY, HD, IIIN, IPAR, JNJ, KALU, K, KELYA, KFRC, KLAC, KSS, LXU, MGY, MAS, MTRN, MDC, MSFT, NTGR, NJR, NEE, NI, JWN, NWPX, NUS, OLN, OMI, PKG, PKE, PEN, PNW, POR, PPL, QCOM, RL, REGN, RNG, ROL, ROST, SAIA, SLB, SPLK, SXI, SSYS, SNPS, TPR, TDOC, TTD, TMO, TDG, RIG, UHAL, SLCA, UIS, VMI, V, VMC, WMB, WOLF, WWW, ITA, IYC, IYE, ITB, IEZ, FTEC, FXL, ICF, IYZ, IXC, IXN, SOXX, EWO, EWI, EWM, EWW, PXJ, PJP, XLE, XHB, XLK, USO, SMH, VONG. Click this link for details (pattern type, start and end dates).
For a list of small patterns (those a few days wide) click this link.
$ $ $
You can find setups based on a Fibonacci retrace by clicking on the link.
The following patterns were found manually, not using Patternz. Mr. Bulkowski has excluded any securities he owns from appearing in the list. However, he may add any of the securities listed to his portfolio at any time, just as you can.
In the table below, the red and green colors are based on the historical breakout direction for the associated chart pattern. If a high and tight flag appears, the start and end dates highlight the flagpole only and not the flag.
For details about the chart patterns, click here.
-- Thomas Bulkowski
![]()
| Symbol | Chart Pattern | Bullish Bearish | Start | End | Industry |
| ALRM | Three Rising Valleys | 01/10/2024 | 02/02/2024 | Computer Software and Svcs | |
| DOX | Double Top, Eve and Adam | 01/22/2024 | 02/07/2024 | IT Services | |
| AMWD | Triangle, symmetrical | 01/22/2024 | 02/08/2024 | Building Materials | |
| AON | Pipe top | 01/16/2024 | 01/22/2024 | Insurance (Diversified) | |
| ARCB | Triangle, ascending | 12/04/2023 | 02/01/2024 | Trucking/Transp. Leasing | |
| BALL | Head-and-shoulders bottom | 01/03/2024 | 02/01/2024 | Packaging and Container | |
| BA | Diamond bottom | 01/16/2024 | 02/08/2024 | Aerospace/Defense | |
| BOOT | Horn bottom | 01/02/2024 | 01/16/2024 | Shoe | |
| CCK | Dead-cat bounce | 02/06/2024 | 02/06/2024 | Packaging and Container | |
| CMI | Head-and-shoulders bottom | 12/22/2023 | 02/06/2024 | Machinery | |
| EL | Pipe bottom | 01/16/2024 | 01/22/2024 | Toiletries/Cosmetics | |
| FLS | Triangle, symmetrical | 10/17/2023 | 12/12/2023 | Machinery | |
| GPS | Double Bottom, Adam and Adam | 01/18/2024 | 01/31/2024 | Apparel | |
| GS | Diamond top | 12/28/2023 | 02/08/2024 | Securities Brokerage | |
| HELE | Triple top | 12/14/2023 | 01/26/2024 | Toiletries/Cosmetics | |
| IDXX | Double Bottom, Adam and Adam | 01/17/2024 | 02/01/2024 | Drug | |
| IPAR | Triple bottom | 01/05/2024 | 01/25/2024 | Toiletries/Cosmetics | |
| LZB | Double Bottom, Eve and Eve | 01/18/2024 | 02/02/2024 | Furn/Home Furnishings | |
| LEN | Roof, inverted | 01/10/2024 | 02/08/2024 | Homebuilding | |
| MHO | Double Top, Eve and Adam | 12/29/2023 | 01/22/2024 | Homebuilding | |
| MTRX | Double Bottom, Adam and Eve | 01/19/2024 | 02/05/2024 | Oilfield Svcs/Equipment | |
| ^IXIC | Three Rising Valleys | 10/26/2023 | 01/05/2024 | None | |
| NOV | Double Top, Eve and Adam | 12/26/2023 | 01/25/2024 | Oilfield Svcs/Equipment | |
| NOVT | Head-and-shoulders bottom | 01/05/2024 | 02/06/2024 | Precision Instrument | |
| PANW | Flag | 01/23/2024 | 02/06/2024 | Computer Software and Svcs | |
| PEN | Three Rising Valleys | 11/10/2023 | 01/05/2024 | Medical Supplies | |
| PRU | Double Bottom, Eve and Adam | 01/18/2024 | 02/01/2024 | Insurance (Life) | |
| SLB | Pipe top | 01/22/2024 | 01/29/2024 | Oilfield Svcs/Equipment | |
| SKX | Diamond top | 01/10/2024 | 02/01/2024 | Shoe | |
| UIS | Pipe top | 01/22/2024 | 01/29/2024 | Computers and Peripherals |
![]()
Since I post this the night before, check how the futures are trading before market open. Large moves can affect the opening direction.
$ $ $
I show a picture of the Nasdaq composite on the 5-minute scale.
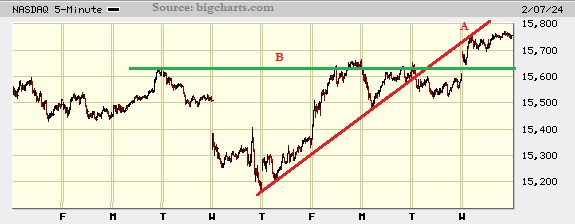
There's not much to say about this chart. I drew two trendlines. The first is the red one that starts by showing support on Thursday but runs into trouble when the index falls below it on Tuesday. Support has turned into resistance. You can see resistance at A where the index touches the line and bounces off.
The second one is the green trendline. I drew this connecting the Tuesday peak on the left to the right, just to see where the peaks Friday to Tuesday line up. On Wednesday, the market gaps open higher, skipping right over the green line.
$ $ $
Here's a symbol list of 183 chart and candlestick patterns (13 "investment grade" candle patterns) found in today's securities using my version of Patternz: ABT, AXDX, ACIW, AEIS, AES, ALRM, AYX, DOX, AWI, ARW, ATO, ADSK, AVY, AZTA, BAX, BERY, BIIB, BKH, BKNG, BOOT, BRC, BR, BRKR, BLDR, CACI, CPB, CENX, CTAS, CNX, CMCO, CAG, COST, COTY, CCRN, CMI, DDS, ^DJI, D, DRQ, DTE, EXP, ECL, ELV, EME, EVRG, FARO, FAST, FLS, FORM, FWRD, GD, GILD, GPRO, GGG, GFF, THG, HLIT, HTLD, HSIC, HWM, IDA, IBP, IPAR, IPG, IRM, JAZZ, JBLU, KALU, K, KELYA, KSS, LZB, LXU, MGY, MAN, MCHX, MLM, MAS, MDC, MRCY, MCO, MOS, NBR, NWL, NKE, JWN, NOC, NOVT, NUS, OLN, OMCL, OMC, OUT, PKG, PANW, PKE, PRFT, PNW, RMBS, RNG, RHI, RCKY, ^GSPC, SLB, STR, SO, SR, SCS, TPR, TECH, TEVA, TMO, TJX, TDG, RIG, TG, TREX, UHAL, UIS, UNH, UNM, VFC, VMI, VC, VMC, WU, WMB, WWW, WDAY, XEL, IYM, IYC, IEZ, DDM, IYH, IHF, IAT, IYZ, MXI, SLV, EWO, EWK, EIS, EWY, EWP, TUR, IBB, PPA, DBA, PBE, PXJ, PJP, SSO, XLY, XHB, XLI, XLB, SPY, UNG, USO, VIS, MGK, VONG. Click this link for details (pattern type, start and end dates).
For a list of small patterns (those a few days wide) click this link.
$ $ $
The following table shows where Fibonacci retrace values of the day's high-low range are plus pivot points, calculated on the Nasdaq composite, sorted by value. When several are near each other (small differences), the area might act as support or resistance.
-- Thomas Bulkowski
![]()
| © 2024 ThePatternSite.com Metric | Value | Diff | Close (within 10% of the high-low range for the day)? |
| Monthly S2 | 14,112.83 | ||
| Monthly S1 | 14,934.74 | 821.90 | |
| Weekly S2 | 15,020.73 | 85.99 | |
| Monthly Pivot | 15,299.47 | 278.75 | |
| Weekly S1 | 15,388.68 | 89.21 | |
| Weekly Pivot | 15,526.45 | 137.76 | |
| Daily S2 | 15,599.51 | 73.06 | |
| Low | 15,645.81 | 46.30 | |
| Daily S1 | 15,678.07 | 32.26 | |
| Open | 15,690.35 | 12.28 | Yes! The Open is close to the Daily S1. |
| 61.8% Down from Intraday High | 15,693.51 | 3.16 | Yes! The 61.8% Down from Intraday High is close to the Open. |
| 50% Down from Intraday High | 15,708.25 | 14.73 | |
| 38.2% Down from Intraday High | 15,722.98 | 14.73 | |
| Daily Pivot | 15,724.38 | 1.40 | Yes! The Daily Pivot is close to the 38.2% Down from Intraday High. |
| Close | 15,756.64 | 32.26 | |
| High | 15,770.68 | 14.04 | |
| Daily R1 | 15,802.94 | 32.26 | |
| Daily R2 | 15,849.25 | 46.30 | |
| Weekly R1 | 15,894.40 | 45.16 | |
| Weekly R2 | 16,032.17 | 137.76 | |
| Monthly R1 | 16,121.38 | 89.21 | |
| Monthly R2 | 16,486.11 | 364.74 |
This is a picture of the chart pattern indicator on the daily scale. The indicator is the line chart below a chart of the S&P 500 composite.
The CPI turned bearish three trading days ago, suggesting but not guaranteeing that the indicator won't change. It can change for up to a week but is usually stable after 3 days. That happens if the market were to make a big move (up in this case).
The red line is the percentage of stocks at least 20% below their 1-year high (plotted upside down). The blue line is the average percentage drop of stocks below their 1-year high (plotted upside down).
On Tuesday, 31% of stocks in my database are in bear market territory (down at least 20% from their 1-year high).A week ago, it was 28%.The fewest was 25% on 12/26/2023.And the most was 56% on 10/27/2023.
The 516 stocks in my database are down an average of 16% from their yearly high.A week ago, the average was 14%.The peak was 13% on 12/26/2023.And the bottom was 25% on 10/27/2023.
Both the red and blue lines are more bearish today than they were a week ago. Both lines looked like they peaked in December and have been sliding lower since.
Both charts are hinting or outright yelling that this upward trend is losing steam. Does that mean a reversal is imminent? No.
This is the first time I've noticed that the above chart shows a meaningful result (usually the two lines follow the market index). It shows divergence between price action and the indicators. Translation: I'd be careful going forward. The markets might drop. It could shoot upward, but there's underlying weakness building.
$ $ $
Here's a symbol list of 140 chart and candlestick patterns (13 "investment grade" candle patterns) found in today's securities using my version of Patternz: MMM, AXDX, ACIW, APD, ATSG, ALRM, AME, ANIK, AON, AAPL, BAX, BBY, BIO, BAH, BCO, BMY, BBW, CBT, CDNS, CNC, CENX, CNX, CTSH, CCRN, CCK, CTS, DDS, EG, FFIV, FE, FLS, FMC, FORM, FWRD, FRD, GNW, GS, HLIT, HIG, HE, HELE, DHI, HUN, IPAR, TILE, INTU, JBLU, KALU, KELYA, KFRC, KLAC, KSS, LRCX, RAMP, LXU, MHO, MGY, MCHX, MA, MTRX, MGEE, NBR, NJR, NWL, JWN, NUS, NVDA, OLN, ORCL, OR, OMI, PKG, PANW, PKE, PATK, PDCO, PTEN, PEN, PPG, PINC, PFG, RMBS, RNG, ROK, ROST, SLB, SAIC, SMG, NOW, STR, SCCO, SUM, SNPS, TECH, TEVA, TOL, RIG, TG, UIS, UPS, VFC, MDRX, IYC, IEZ, IHE, FXI, IYZ, IGV, SOXX, EWK, EEM, EWG, EIS, EWP, EWT, THD, TUR, PBE, PEJ, PXJ, PJP, XLY, XLF, XRT, UNG, USO, SMH, VAW. Click this link for details (pattern type, start and end dates).
For a list of small patterns (those a few days wide) click this link.
-- Thomas Bulkowski
![]()
$ $ $
I show another slider trading quiz featuring Diamond bottom.
$ $ $
Here's a symbol list of 120 chart and candlestick patterns (13 "investment grade" candle patterns) found in today's securities using my version of Patternz: DDD, MMM, APD, ATSG, ALK, AA, AMN, ANIK, AON, BMI, BAX, BKH, BAH, BMY, BBW, CBT, CALM, CLS, CHKP, CONN, COTY, CCRN, CCK, CSGS, XRAY, DVN, DFS, EL, FNV, FCX, GNW, GFS, GOOGL, GPRO, HBI, HAYN, HL, HNI, HON, HOV, HURC, IDXX, IIIN, IPAR, NVTA, JNJ, KELYA, LLY, LMT, LPLA, MCHX, MTDR, MTRX, MGEE, MU, NWL, NEE, NWPX, NVDA, OXY, OLN, OTEX, ORCL, OUT, PDCO, PTEN, PINC, RTX, REGN, RNG, RLI, RCKY, RGLD, RES, SAND, SMG, SCCO, SCS, TG, SLCA, UNM, VLO, WEX, WOLF, WWD, IYM, IEZ, IHE, ICF, IYZ, IGV, EWO, EWG, EPP, EWS, EZA, EWU, PXJ, PJP, GLD, XAR, VAW. Click this link for details (pattern type, start and end dates).
For a list of small patterns (those a few days wide) click this link.
$ $ $
The following table shows where Fibonacci retrace values of the day's high-low range are plus pivot points, calculated on the Dow industrials, sorted by value. When several are near each other (small differences), the area might act as support or resistance.
-- Thomas Bulkowski
![]()
| © 2024 ThePatternSite.com Metric | Value | Diff | Close (within 10% of the high-low range for the day)? |
| Monthly S2 | 36,434.89 | ||
| Monthly S1 | 37,407.51 | 972.61 | |
| Weekly S2 | 37,685.85 | 278.34 | |
| Daily S2 | 37,997.99 | 312.14 | |
| Weekly S1 | 38,032.99 | 35.00 | Yes! The Weekly S1 is close to the Daily S2. |
| Monthly Pivot | 38,095.56 | 62.57 | |
| Daily S1 | 38,189.05 | 93.49 | |
| Low | 38,220.40 | 31.34 | Yes! The Low is close to the Daily S1. |
| 61.8% Down from Intraday High | 38,378.35 | 157.95 | |
| Close | 38,380.12 | 1.77 | Yes! The Close is close to the 61.8% Down from Intraday High. |
| Weekly Pivot | 38,408.30 | 28.18 | Yes! The Weekly Pivot is close to the Close. |
| Daily Pivot | 38,411.46 | 3.16 | Yes! The Daily Pivot is close to the Weekly Pivot. |
| 50% Down from Intraday High | 38,427.14 | 15.68 | Yes! The 50% Down from Intraday High is close to the Daily Pivot. |
| 38.2% Down from Intraday High | 38,475.93 | 48.79 | |
| Open | 38,546.77 | 70.84 | |
| Daily R1 | 38,602.54 | 55.77 | |
| High | 38,633.88 | 31.34 | Yes! The High is close to the Daily R1. |
| Weekly R1 | 38,755.44 | 121.56 | |
| Daily R2 | 38,824.95 | 69.51 | |
| Monthly R1 | 39,068.18 | 243.23 | |
| Weekly R2 | 39,130.75 | 62.58 | |
| Monthly R2 | 39,756.23 | 625.48 |
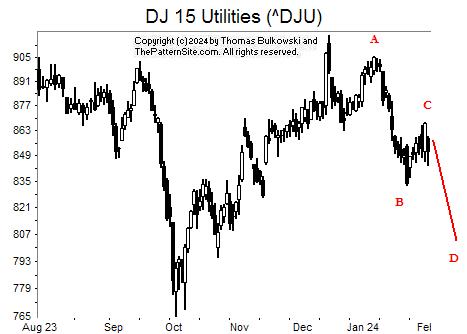
I show the Dow utilities on the daily scale.
There's not much to say about the chart.
One could argue that there's a measured move down chart pattern forming at ABCD.
The thinking with this pattern is that the CD leg will equal the length and duration of leg AB. What I like about this pattern is that when it completes, the index often returns to the corrective phase, BC.
So you can expect a retrace and trade accordingly. Just remember that the ABCD pattern has to complete first.
![]()
The following is a brief review of how the markets performed over time. The numbers refer to the close-to-close move in the Dow industrials.
No options expire this week.
![]()
The following is based on an SFO article in December 2004 by John Seekinger, titled, "Take a two-dimensional approach." He offers these tips.
| Index | S2 | S1 | Pivot | R1 | R2 |
| Dow Industrials (^DJI): Daily | 38,144 | 38,399 | 38,592 | 38,847 | 39,039 |
| Weekly | 37,777 | 38,216 | 38,500 | 38,938 | 39,222 |
| Monthly | 36,526 | 37,590 | 38,187 | 39,251 | 39,848 |
| S&P500 (^GSPC): Daily | 4,880 | 4,919 | 4,947 | 4,987 | 5,015 |
| Weekly | 4,796 | 4,877 | 4,926 | 5,008 | 5,056 |
| Monthly | 4,579 | 4,769 | 4,872 | 5,062 | 5,165 |
| Nasdaq (^IXIC): Daily | 15,256 | 15,442 | 15,553 | 15,740 | 15,851 |
| Weekly | 14,978 | 15,304 | 15,484 | 15,809 | 15,990 |
| Monthly | 14,070 | 14,850 | 15,257 | 16,036 | 16,444 |
Here are the formulas:
![]()
Earnings season is either underway or should be starting soon. The sessions could be more volatile.
Here's a symbol list of 102 chart and candlestick patterns (13 "investment grade" candle patterns) found in today's securities using my version of Patternz: DDD, ACIW, AFL, AA, ALL, AMZN, AON, ACGL, ANET, AGO, ADSK, BAX, BZH, BOOT, BSX, BMY, CBT, CVX, CI, CINF, CLNE, CLX, CONN, COP, CCK, CSGS, DECK, XRAY, DFS, EL, FDS, FCX, FRD, GILD, GL, GS, GGG, HBI, HIG, HAYN, HOV, IIIN, IPAR, IBKR, INTU, JKHY, JBLU, JNJ, LZB, MGY, MCHX, MKTX, MDC, META, MS, NVDA, OXY, OTEX, ORCL, OUT, PGR, REGN, RLI, ^GSPC, SMG, SEIC, SHOP, SSYS, TDOC, RIG, TZOO, TREX, VMC, WOLF, WWW, WWD, IYC, IHE, FDN, FXI, ICF, IAT, EWO, ECH, EWH, EWS, EZA, EWY, EWU, PBE, PJP, SSO, XHB, SPY, USO, MGK, VONG. Click this link for details (pattern type, start and end dates).
For a list of small patterns (those a few days wide) click this link.
The below industries were the best (rank 1) or worst performing of those I follow.
|
-- Thomas Bulkowski
![]()
$ $ $
Here's a symbol list of 156 chart and candlestick patterns (13 "investment grade" candle patterns) found in today's securities using my version of Patternz: ABT, ADTN, AFL, ALK, AA, DOX, AEP, AXP, AFG, AON, APA, ANET, ARW, ADP, AVA, BAX, BERY, BIG, BIIB, BKH, BMY, BR, BG, CBT, CPB, CX, CNP, CINF, CSCO, CLX, CNA, CNO, CL, ED, CAG, CONN, COP, GLW, COST, CCRN, CCK, CSGS, CTS, DVN, DFS, D, DTE, ELV, EOG, EL, EVRG, EZPW, FDS, FICO, FE, FLEX, FORM, FCX, FDP, GNW, GL, GOOGL, GPRO, HBI, HLIT, HE, HSY, HNI, HOV, HUBG, HUN, IDA, IDXX, ITW, IIIN, IPI, IRM, JNJ, K, KLIC, L, MGY, MTRX, MCO, NBR, ^IXIC, NTGR, NEU, NEE, OGE, ORCL, OR, OUT, PLXS, POR, PPL, PFG, PG, PRU, PEG, QCOM, RNG, RLI, ROL, SAIA, SBH, SEIC, SHOP, SMAR, SO, SR, SSYS, SRDX, TGT, TER, TEVA, TTD, TREX, TWLO, UGI, WOLF, XEL, IDU, FDN, FXL, BOTZ, ICF, IHF, IAT, IGV, IXN, ILF, EWI, EWJ, EWS, EZA, EWY, EWD, EWT, THD, TUR, PJP, GLD, XRT, XAR, XLU, MGK. Click this link for details (pattern type, start and end dates).
For a list of small patterns (those a few days wide) click this link.
$ $ $
You can find setups based on a Fibonacci retrace by clicking on the link.
The following patterns were found manually, not using Patternz. Mr. Bulkowski has excluded any securities he owns from appearing in the list. However, he may add any of the securities listed to his portfolio at any time, just as you can.
In the table below, the red and green colors are based on the historical breakout direction for the associated chart pattern. If a high and tight flag appears, the start and end dates highlight the flagpole only and not the flag.
For details about the chart patterns, click here.
-- Thomas Bulkowski
![]()
| Symbol | Chart Pattern | Bullish Bearish | Start | End | Industry |
| AEO | Broadening top | 12/14/2023 | 01/19/2024 | Apparel | |
| BMI | Triple top | 12/14/2023 | 01/23/2024 | Precision Instrument | |
| CONN | Double Top, Eve and Eve | 01/10/2024 | 01/23/2024 | Retail (Special Lines) | |
| CR | Three Rising Valleys | 10/23/2023 | 01/29/2024 | Diversified Co. | |
| CCRN | Double Top, Adam and Adam | 01/02/2024 | 01/10/2024 | Human Resources | |
| FAST | Scallop, ascending and inverted | 11/29/2023 | 01/09/2024 | Retail Building Supply | |
| FLEX | Head-and-shoulders bottom | 01/03/2024 | 01/29/2024 | Electronics | |
| GME | Triangle, symmetrical | 01/11/2024 | 02/01/2024 | Retail (Special Lines) | |
| HOV | Pipe bottom | 01/16/2024 | 01/22/2024 | Homebuilding | |
| JBLU | Double Top, Eve and Adam | 12/14/2023 | 01/08/2024 | Air Transport | |
| JNJ | Double Top, Adam and Adam | 01/09/2024 | 01/22/2024 | Medical Supplies | |
| KLIC | Triple top | 12/15/2023 | 01/25/2024 | Semiconductor Cap Equip. | |
| OR | Pipe bottom | 01/02/2024 | 01/08/2024 | Metals and Mining (Div.) | |
| RLI | Pipe top | 01/16/2024 | 01/22/2024 | Insurance (Prop/Casualty) | |
| SRDX | Dead-cat bounce | 02/01/2024 | 02/01/2024 | Medical Supplies | |
| TER | Double Top, Eve and Eve | 12/27/2023 | 01/24/2024 | Semiconductor Cap Equip. | |
| TREX | Triangle, symmetrical | 12/20/2023 | 01/31/2024 | Building Materials | |
| UPS | Triple top | 12/18/2023 | 01/26/2024 | Air Transport | |
| VEEV | Three Rising Valleys | 11/10/2023 | 01/08/2024 | Healthcare Information | |
| WSC | Double Bottom, Eve and Eve | 01/08/2024 | 01/16/2024 | Industrial Services |
![]()
Since I post this the night before, check how the futures are trading before market open. Large moves can affect the opening direction.
Here's the updated 2024 market forecast, presented in slider format.
$ $ $
Here's a symbol list of 238 chart and candlestick patterns (13 "investment grade" candle patterns) found in today's securities using my version of Patternz: ABM, AFL, A, ALB, AA, ALL, AMED, AEE, AFG, AMWD, AME, AON, APA, APOG, AAPL, ATR, ARCB, ARW, ASH, AIZ, AGO, BCPC, BAX, BECN, BERY, BIO, BAH, BSX, BRC, BR, CBT, CE, CNC, CENX, CF, CRL, CHKP, CVX, CHD, CINF, CNA, CNO, CTSH, CMCO, CAG, CONN, COP, GLW, CCK, CSGS, DHR, DVN, FANG, DFS, DSGR, ^DJU, EMN, ECL, EMR, EOG, EQT, EL, EG, EXC, EXPD, FDS, FIS, FE, FISV, FLS, FMC, FORM, FTV, FCX, FDP, GME, GD, GNW, GL, GMS, GFF, HBI, HE, HAYN, HQY, HNI, HOLX, HD, HOV, HUBG, JBHT, IDXX, ITW, ILMN, IIIN, ITGR, TILE, IPI, IRM, JKHY, K, KMT, KMB, KLIC, LHX, LH, LEG, LDOS, LLY, LMT, L, MGY, MANH, MKTX, MRTN, MA, MTDR, MTRN, MTRX, MRK, MSFT, NBR, NFG, NOV, NEU, NI, NWPX, OR, POR, PPG, PINC, KWR, RL, REGN, RGA, RLI, RHI, ROK, ROL, R, SBH, SLB, SMG, SEE, SIGI, SCCO, SWX, SPSC, SXI, SSYS, TRGP, TER, TXT, TJX, TSCO, TRV, TZOO, TG, UHAL, SLCA, UPS, UNM, WMT, WAT, WERN, WU, WLK, WEX, WMB, WWD, ZBRA, IYM, IEZ, IHE, IDU, DDM, ICF, IYH, IEV, IXC, MXI, IXN, IGE, IHI, EWA, EWO, EWK, EWC, EWQ, EWI, EPP, EZA, EWD, EWU, PPA, PJP, PHO, GLD, XLV, XLB, XLU, VAW. Click this link for details (pattern type, start and end dates).
For a list of small patterns (those a few days wide) click this link.
$ $ $
The following table shows where Fibonacci retrace values of the day's high-low range are plus pivot points, calculated on the Nasdaq composite, sorted by value. When several are near each other (small differences), the area might act as support or resistance.
-- Thomas Bulkowski
![]()
| © 2024 ThePatternSite.com Metric | Value | Diff | Close (within 10% of the high-low range for the day)? |
| Monthly S2 | 13,938.72 | ||
| Monthly S1 | 14,551.36 | 612.65 | |
| Daily S2 | 14,995.62 | 444.25 | |
| Daily S1 | 15,079.81 | 84.20 | |
| Weekly S2 | 15,080.13 | 0.32 | Yes! The Weekly S2 is close to the Daily S1. |
| Monthly Pivot | 15,090.22 | 10.09 | Yes! The Monthly Pivot is close to the Weekly S2. |
| Weekly S1 | 15,122.07 | 31.85 | |
| Low | 15,158.49 | 36.42 | |
| Close | 15,164.01 | 5.52 | Yes! The Close is close to the Low. |
| Daily Pivot | 15,242.69 | 78.68 | |
| 61.8% Down from Intraday High | 15,252.87 | 10.18 | Yes! The 61.8% Down from Intraday High is close to the Daily Pivot. |
| 50% Down from Intraday High | 15,282.03 | 29.15 | |
| 38.2% Down from Intraday High | 15,311.18 | 29.15 | |
| Open | 15,324.19 | 13.01 | Yes! The Open is close to the 38.2% Down from Intraday High. |
| Daily R1 | 15,326.88 | 2.69 | Yes! The Daily R1 is close to the Open. |
| Weekly Pivot | 15,375.57 | 48.69 | |
| High | 15,405.56 | 29.99 | |
| Weekly R1 | 15,417.51 | 11.95 | Yes! The Weekly R1 is close to the High. |
| Daily R2 | 15,489.76 | 72.25 | |
| Weekly R2 | 15,671.01 | 181.25 | |
| Monthly R1 | 15,702.86 | 31.85 | |
| Monthly R2 | 16,241.72 | 538.85 |
Support this site! Clicking any of the books (below) takes you to
Amazon.com If you buy ANYTHING while there, they pay for the referral.
Legal notice for paid links: "As an Amazon Associate I earn from qualifying purchases."
|
My Stock Market Books
|
My Novels
Orb Foresight Rewrite Coming!
|