
As of 04/02/2026
Indus: 46,505 -61.07 -0.1%
Trans: 19,089 +159.40 +0.8%
Utils: 1,174 +8.73 +0.7%
Nasdaq: 21,879 +38.23 +0.2%
S&P 500: 6,583 +7.37 +0.1%
|
YTD
-3.2%
+10.0%
+9.9%
-5.9%
-3.8%
|
|
As of 04/02/2026
Indus: 46,505 -61.07 -0.1%
Trans: 19,089 +159.40 +0.8%
Utils: 1,174 +8.73 +0.7%
Nasdaq: 21,879 +38.23 +0.2%
S&P 500: 6,583 +7.37 +0.1%
|
YTD
-3.2%
+10.0%
+9.9%
-5.9%
-3.8%
| |
|
| ||
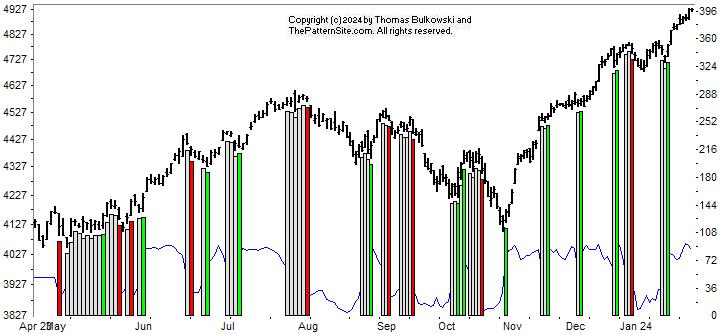
This is a picture of the chart pattern indicator on the daily scale. The indicator is the line chart below a chart of the S&P 500 composite.
The CPI has erased any bearish or neutral signal to show the latest one as bullish. Recall that the CPI can change its mind for up to a week. In the last two days, the indicator has slipped a bit.
The CPI suggests the uptrend will continue but I still expect a retrace. That's especially true in the Nasdaq where I expect weakness in the coming week before an uptrend resumes. That's a guess, though. I've nothing to back that up except hope and a feeling.
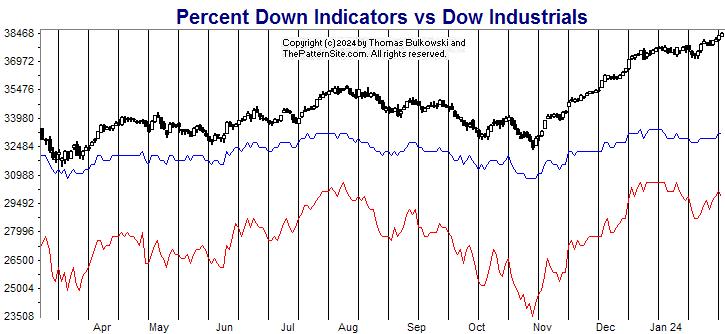
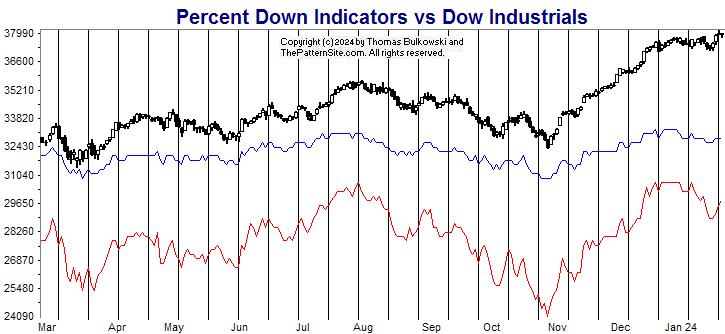
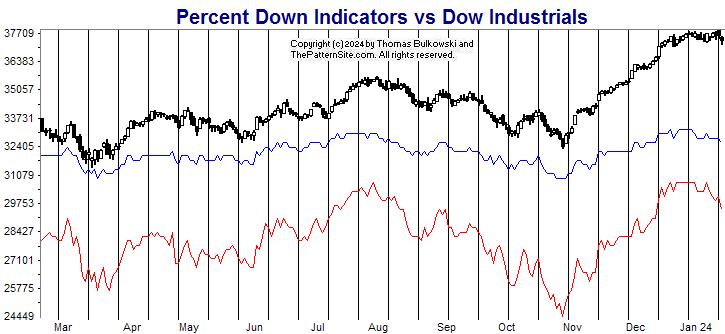
The red line is the percentage of stocks at least 20% below their 1-year high (plotted upside down). The blue line is the average percentage drop of stocks below their 1-year high (plotted upside down).
On Tuesday, 29% of stocks in my database are in bear market territory (down at least 20% from their 1-year high).A week ago, it was 30%.The fewest was 26% on 12/26/2023.And the most was 56% on 10/27/2023.
The 517 stocks in my database are down an average of 15% from their yearly high.A week ago, the average was 15%.The peak was 13% on 12/26/2023.And the bottom was 25% on 10/27/2023.
The red line shows improvement compared to a week ago but the blue line is flat.
Both lines are bullish if you ignore that the index is making new highs but the two lines (red and blue) are not. I think that suggests weakness but we haven't really seen any reaction to that and it's been several weeks of this unfolding.
Both charts are bullish this week but I'm still expecting a retrace. Of course, I've been expecting a retrace for about two months now, so what do I know? ![]()
$ $ $
Here's a symbol list of 144 chart and candlestick patterns (13 "investment grade" candle patterns) found in today's securities using my version of Patternz: AKAM, ALB, AA, AXP, AIG, APH, AR, AON, APA, AGO, BCPC, BAX, BOOT, BMY, CX, CNC, CNP, CENX, CF, CRL, CVX, CTAS, CNX, CL, CMTL, CONN, COP, GLW, CR, CRH, CCRN, DHR, DVN, FANG, DFS, BOOM, EMN, ECL, WIRE, EOG, EL, EZPW, FFIV, FDS, FMC, FNV, FCX, GME, GD, GILD, GS, GGG, HBI, HE, HP, HOLX, HOV, HWM, HUN, IDA, ILMN, INCY, IIIN, IBKR, TILE, IPG, LEG, MGY, MAN, MTRX, MRK, MSFT, NOV, NEU, JWN, OXY, PAYX, PYPL, PEN, PNW, PLXS, PGR, PRU, PEG, KWR, RJF, RGS, RLI, ROK, ROP, RES, SAND, SLB, SMTC, STR, LUV, SXI, SSYS, TRGP, TER, TMO, TZOO, SLCA, UGI, VMC, WLK, WMB, WWD, IAI, IYC, IHE, FXL, FXI, IEV, IXN, SLV, IEO, EWC, EWH, EIS, EWW, EZA, PJP, XLB, USO, VONG. Click this link for details (pattern type, start and end dates).
For a list of small patterns (those a few days wide) click this link.
-- Thomas Bulkowski
![]()
$ $ $
I show another slider trading quiz featuring Rectangle tops.
$ $ $
Here's a symbol list of 123 chart and candlestick patterns (13 "investment grade" candle patterns) found in today's securities using my version of Patternz: ACN, AYI, AEIS, ATSG, AKAM, AFG, AME, AMN, APH, APOG, ARW, BAX, BZH, BOOT, BR, CBT, CPB, CRL, CHKP, CIEN, CMCO, CMTL, GLW, CRH, CROX, CTS, XRAY, DOV, BOOM, EMR, EL, XOM, EZPW, FDS, FDX, FTV, GILD, HBI, THG, HAYN, HOLX, HON, HOV, HUN, ITW, ILMN, IBKR, IPG, IPI, JKHY, JAZZ, KALU, KMT, KEYS, KFRC, L, MTDR, MGEE, MSFT, MLKN, JWN, NWPX, OUT, PKE, PYPL, PFE, QCOM, RL, RGS, ROK, RGLD, ^GSPC, SBH, SLB, SEIC, SMTC, SCI, SHW, SMAR, LUV, SXI, SRDX, TPR, TER, TDG, RIG, UHAL, UGI, VMI, VC, WU, WSM, WWD, WDAY, IAI, IYC, IHE, IGV, SLV, EWQ, EWG, EIS, EWM, EPP, EWY, EWP, TUR, EWU, PBE, PJP, SSO, ROBO, XLI, XRT, SPY, VIS. Click this link for details (pattern type, start and end dates).
For a list of small patterns (those a few days wide) click this link.
$ $ $
The following table shows where Fibonacci retrace values of the day's high-low range are plus pivot points, calculated on the Dow industrials, sorted by value. When several are near each other (small differences), the area might act as support or resistance.
-- Thomas Bulkowski
![]()
| © 2024 ThePatternSite.com Metric | Value | Diff | Close (within 10% of the high-low range for the day)? |
| Monthly S2 | 36,798.21 | ||
| Monthly S1 | 37,565.83 | 767.62 | |
| Weekly S2 | 37,695.22 | 129.39 | |
| Monthly Pivot | 37,890.57 | 195.35 | |
| Daily S2 | 37,963.42 | 72.85 | |
| Weekly S1 | 38,014.34 | 50.91 | |
| Low | 38,061.17 | 46.84 | |
| Weekly Pivot | 38,114.82 | 53.65 | |
| Open | 38,115.83 | 1.00 | Yes! The Open is close to the Weekly Pivot. |
| Daily S1 | 38,148.44 | 32.61 | |
| 61.8% Down from Intraday High | 38,169.18 | 20.75 | Yes! The 61.8% Down from Intraday High is close to the Daily S1. |
| 50% Down from Intraday High | 38,202.55 | 33.37 | |
| 38.2% Down from Intraday High | 38,235.91 | 33.36 | |
| Daily Pivot | 38,246.18 | 10.27 | Yes! The Daily Pivot is close to the 38.2% Down from Intraday High. |
| Close | 38,333.45 | 87.27 | |
| High | 38,343.93 | 10.48 | Yes! The High is close to the Close. |
| Daily R1 | 38,431.20 | 87.27 | |
| Weekly R1 | 38,433.94 | 2.74 | Yes! The Weekly R1 is close to the Daily R1. |
| Daily R2 | 38,528.94 | 95.00 | |
| Weekly R2 | 38,534.42 | 5.48 | Yes! The Weekly R2 is close to the Daily R2. |
| Monthly R1 | 38,658.19 | 123.77 | |
| Monthly R2 | 38,982.93 | 324.74 |
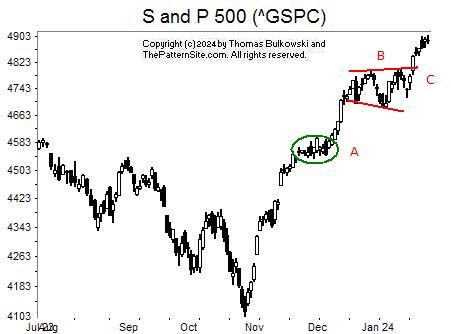
I show a chart of the S&P 500 index on the daily scale.
The index continues to rise. It broke out upward from a consolidation pattern (B), loosely called a broadening top.
When the index retraces, and it will, look for the index to drop back to C. That's the top of the broadening pattern.
The decline can continued below that, too. Look for the index to find support at the knot circled in green, at A.
I guess the real question is when will the index retrace? History says the index will bottom in early February. That's next week. That seems to be a wish rather than a given.
I'm still waiting for a significant retrace before I deploy my cash. I have my doubts that we'll see it anytime soon. So don't expect the index to reach A or even C in the next week or two.
![]()
The following is a brief review of how the markets performed over time. The numbers refer to the close-to-close move in the Dow industrials.
No options expire this week.
![]()
The following is based on an SFO article in December 2004 by John Seekinger, titled, "Take a two-dimensional approach." He offers these tips.
| Index | S2 | S1 | Pivot | R1 | R2 |
| Dow Industrials (^DJI): Daily | 37,890 | 38,000 | 38,108 | 38,217 | 38,325 |
| Weekly | 37,621 | 37,865 | 38,040 | 38,285 | 38,460 |
| Monthly | 36,724 | 37,416 | 37,816 | 38,509 | 38,908 |
| S&P500 (^GSPC): Daily | 4,868 | 4,879 | 4,893 | 4,905 | 4,918 |
| Weekly | 4,818 | 4,854 | 4,881 | 4,917 | 4,943 |
| Monthly | 4,602 | 4,746 | 4,827 | 4,971 | 5,051 |
| Nasdaq (^IXIC): Daily | 15,370 | 15,413 | 15,476 | 15,518 | 15,582 |
| Weekly | 15,177 | 15,316 | 15,473 | 15,612 | 15,768 |
| Monthly | 14,036 | 14,746 | 15,187 | 15,897 | 16,339 |
Here are the formulas:
![]()
Earnings season is either underway or should be starting soon. The sessions could be more volatile.
Here's a symbol list of 131 chart and candlestick patterns (13 "investment grade" candle patterns) found in today's securities using my version of Patternz: AYI, ATSG, AEP, AXP, AME, ARW, AIZ, BALL, BAX, BIO, BOOT, BAH, BFH, CAL, COR, CRL, CNO, CGNX, CTSH, CMTL, CR, DHR, XRAY, DSGR, ^DJT, BOOM, EXP, EMR, EZPW, FDX, FISV, FLEX, FMC, FORM, FNV, FDP, GILD, GPN, GL, HBI, HIG, HAYN, HQY, HSII, IDA, ILMN, INCY, INFN, IBP, INTC, IRM, JKHY, KLIC, LH, LEG, LMT, L, MTSI, MGY, MAN, MLKN, MOS, NTAP, NEU, JWN, PKE, PATK, PYPL, PFE, PCG, PLXS, DGX, RGS, ROK, RES, ^GSPC, SLB, SIGI, SMTC, SCI, LUV, TPR, TECH, TDY, TER, TXN, TG, SLCA, UNM, VECO, VMC, WU, WSM, WDAY, IYC, IHE, FDN, ICF, IEV, MXI, EWO, EWK, EWQ, EWG, EWS, EZA, TUR, EWU, IBB, PEJ, PJP, SSO, XRT, SPY, USO. Click this link for details (pattern type, start and end dates).
For a list of small patterns (those a few days wide) click this link.
The below industries were the best (rank 1) or worst performing of those I follow.
|
-- Thomas Bulkowski
![]()
$ $ $
Here's a symbol list of 149 chart and candlestick patterns (13 "investment grade" candle patterns) found in today's securities using my version of Patternz: ADTN, AES, ALK, ALKS, ALGT, DOX, AEP, AMWD, AAPL, ADM, ASH, AIZ, ADP, BSET, BAX, BZH, BIO, BKH, BA, BOOT, BSX, BFH, BMY, BLDR, CAL, CNC, CNP, CVX, CLX, CGNX, CTSH, ED, CXW, DDS, D, DUK, BOOM, EMN, EPAM, EZPW, FFIV, FDS, FORM, FDP, GL, HBI, HLIT, HD, HUM, HURC, ILMN, NSP, IIIN, INTC, IPAR, IBKR, NVTA, KBH, LRCX, LEN, L, MHO, M, MCHX, MKTX, MLM, MTRN, MRK, MSFT, NEU, NEE, JWN, NOC, ORI, OR, PKG, PKE, PAYX, PYPL, PRFT, PFE, PXD, PLXS, POR, PPL, DGX, RGS, RNG, ROK, ROL, SLB, SIGI, SMTC, SKYW, SO, LUV, SR, SPSC, SXI, SNPS, TER, TXN, TOL, TREX, VFC, VLO, VECO, VEEV, VRSN, VMC, WRB, WOLF, WDAY, XEL, ITA, IHE, IDU, QTEC, ICF, IYH, IHF, IXC, SLV, IHI, EWW, PJP, XLE, XLV, XLU, UNG, USO. Click this link for details (pattern type, start and end dates).
For a list of small patterns (those a few days wide) click this link.
$ $ $
You can find setups based on a Fibonacci retrace by clicking on the link.
The following patterns were found manually, not using Patternz. Mr. Bulkowski has excluded any securities he owns from appearing in the list. However, he may add any of the securities listed to his portfolio at any time, just as you can.
In the table below, the red and green colors are based on the historical breakout direction for the associated chart pattern. If a high and tight flag appears, the start and end dates highlight the flagpole only and not the flag.
For details about the chart patterns, click here.
-- Thomas Bulkowski
![]()
| Symbol | Chart Pattern | Bullish Bearish | Start | End | Industry |
| ACN | Pipe bottom | 01/02/2024 | 01/08/2024 | IT Services | |
| ADBE | Head-and-shoulders bottom | 12/15/2023 | 01/17/2024 | Computer Software and Svcs | |
| AMD | Three Rising Valleys | 10/26/2023 | 01/03/2024 | Semiconductor | |
| AFL | Double Bottom, Adam and Adam | 12/15/2023 | 01/09/2024 | Insurance (Diversified) | |
| AMWD | Three Rising Valleys | 10/27/2023 | 01/09/2024 | Building Materials | |
| APH | Double Bottom, Adam and Adam | 01/04/2024 | 01/17/2024 | Electronics | |
| AAPL | Double Bottom, Eve and Adam | 01/05/2024 | 01/17/2024 | Computers and Peripherals | |
| ADM | Dead-cat bounce | 01/22/2024 | 01/22/2024 | Food Processing | |
| AWI | Channel | 12/15/2023 | 01/24/2024 | Building Materials | |
| ATO | Double Top, Adam and Eve | 12/14/2023 | 01/08/2024 | Natural Gas (Diversified) | |
| AVA | Double Top, Adam and Eve | 12/14/2023 | 01/05/2024 | Electric Utility (West) | |
| AXS | Double Bottom, Adam and Adam | 12/21/2023 | 01/16/2024 | Insurance (Prop/Casualty) | |
| BECN | Double Top, Eve and Adam | 12/27/2023 | 01/08/2024 | Retail Building Supply | |
| BMRN | Double Top, Adam and Eve | 12/14/2023 | 01/08/2024 | Biotechnology | |
| BKH | Double Top, Adam and Eve | 12/14/2023 | 01/08/2024 | Electric Utility (West) | |
| BKNG | Three Rising Valleys | 10/26/2023 | 01/04/2024 | Internet | |
| CX | Double Bottom, Eve and Eve | 01/04/2024 | 01/17/2024 | Cement and Aggregates | |
| CF | Double Bottom, Eve and Adam | 12/05/2023 | 12/12/2023 | Chemical (Basic) | |
| ED | Double Top, Adam and Eve | 12/14/2023 | 01/10/2024 | Electric Utility (East) | |
| CAG | Triangle, descending | 12/14/2023 | 01/22/2024 | Food Processing | |
| CSGP | Double Bottom, Adam and Adam | 01/05/2024 | 01/17/2024 | Information Services | |
| DUK | Double Top, Adam and Eve | 12/14/2023 | 01/10/2024 | Electric Utility (East) | |
| FE | Double Top, Adam and Eve | 12/14/2023 | 01/10/2024 | Electric Utility (East) | |
| FIVN | Double Bottom, Eve and Adam | 01/05/2024 | 01/17/2024 | Computer Software and Svcs | |
| FTV | Double Bottom, Eve and Eve | 01/03/2024 | 01/17/2024 | Industrial Services | |
| IT | Pipe bottom | 01/02/2024 | 01/08/2024 | IT Services | |
| HSY | Triangle, descending | 01/04/2024 | 01/25/2024 | Food Processing | |
| DHI | Double Top, Eve and Adam | 01/10/2024 | 01/22/2024 | Homebuilding | |
| JBHT | Double Bottom, Adam and Eve | 01/04/2024 | 01/16/2024 | Trucking/Transp. Leasing | |
| INFN | Three Rising Valleys | 10/30/2023 | 01/04/2024 | Telecom. Equipment | |
| ITGR | Three Rising Valleys | 10/25/2023 | 01/03/2024 | Electronics | |
| IRM | Double Bottom, Adam and Eve | 01/03/2024 | 01/17/2024 | Industrial Services | |
| KEYS | Double Bottom, Eve and Eve | 01/05/2024 | 01/17/2024 | Precision Instrument | |
| KLAC | Three Rising Valleys | 10/26/2023 | 01/05/2024 | Semiconductor Cap Equip. | |
| LRCX | Three Rising Valleys | 10/31/2023 | 01/04/2024 | Semiconductor Cap Equip. | |
| RAMP | Pipe bottom | 01/02/2024 | 01/08/2024 | Computer Software and Svcs | |
| LMT | Double Top, Eve and Adam | 01/03/2024 | 01/16/2024 | Aerospace/Defense | |
| MYGN | Pipe bottom | 01/02/2024 | 01/08/2024 | Biotechnology | |
| NOV | Double Bottom, Adam and Adam | 01/11/2024 | 01/17/2024 | Oilfield Svcs/Equipment | |
| JWN | Horn bottom | 01/02/2024 | 01/16/2024 | Retail Store | |
| NOC | Triple top | 12/13/2023 | 01/17/2024 | Aerospace/Defense | |
| NVDA | Three Rising Valleys | 10/31/2023 | 01/03/2024 | Semiconductor | |
| PYPL | Double Bottom, Adam and Adam | 01/04/2024 | 01/17/2024 | Financial Services | |
| PHM | Three Rising Valleys | 10/24/2023 | 01/03/2024 | Homebuilding | |
| KWR | Diamond bottom | 01/09/2024 | 01/24/2024 | Chemical (Specialty) | |
| DGX | Triple top | 12/14/2023 | 01/10/2024 | Medical Services | |
| RMBS | Broadening top | 11/21/2023 | 01/22/2024 | Semiconductor Cap Equip. | |
| RGS | Pipe top | 12/04/2023 | 12/11/2023 | Toiletries/Cosmetics | |
| SLB | Pipe bottom | 01/08/2024 | 01/16/2024 | Oilfield Svcs/Equipment | |
| SRE | Double Top, Adam and Eve | 12/14/2023 | 01/08/2024 | Electric Utility (West) | |
| SMTC | Pipe bottom | 01/08/2024 | 01/16/2024 | Semiconductor Cap Equip. | |
| SCI | Head-and-shoulders bottom | 01/04/2024 | 01/19/2024 | Industrial Services | |
| SO | Head-and-shoulders top | 12/07/2023 | 01/04/2024 | Electric Utility (East) | |
| LUV | Double Bottom, Adam and Adam | 01/03/2024 | 01/16/2024 | Air Transport | |
| TDY | Double Top, Adam and Adam | 12/29/2023 | 01/24/2024 | Aerospace/Defense | |
| TPX | Roof, inverted | 12/15/2023 | 01/25/2024 | Furn/Home Furnishings | |
| TDC | Triple bottom | 12/07/2023 | 01/05/2024 | Computer Software and Svcs | |
| TER | Double Bottom, Adam and Adam | 01/04/2024 | 01/17/2024 | Semiconductor Cap Equip. | |
| TKR | Double Bottom, Adam and Adam | 01/03/2024 | 01/17/2024 | Metal Fabricating | |
| TZOO | Triangle, descending | 12/07/2023 | 01/12/2024 | Internet | |
| WMB | Head-and-shoulders top | 11/06/2023 | 01/04/2024 | Natural Gas (Distributor) |
![]()
Since I post this the night before, check how the futures are trading before market open. Large moves can affect the opening direction.
$ $ $
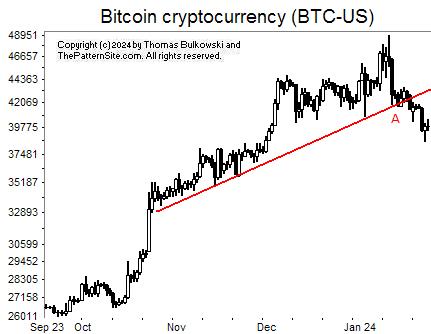
I show a picture of bitcoin (BTC-USD) on the daily chart.
I drew a red trendline as a sell line. I've found that trendlines like this can make for timely exit signals. When the currency closed below the red line, A, it was a sell signal.
Unfortunately, I don't know how far the currency will drop. It has already dropped some... It could drop back to the level of the start of the trendline, about 33,000.
And that's all she wrote. ![]()
$ $ $
Here's a symbol list of 290 chart and candlestick patterns (13 "investment grade" candle patterns) found in today's securities using my version of Patternz: MMM, ABM, AEIS, AMD, AKAM, ALRM, ALKS, AMZN, AEE, AEP, AEL, AME, AMGN, APH, APOG, AAPL, AMAT, ATR, ARCB, AWI, ARW, ATO, ADP, AVNT, AVA, BMI, BCPC, BAX, BECN, BZH, BERY, BKH, BOOT, BCO, BRKR, BG, CBT, CPB, CNP, CSCO, CLX, CNO, CGNX, CTSH, ED, CXW, CR, CRH, CTS, XRAY, DSGR, ^DJU, DOV, DTE, DUK, BOOM, EMN, EIX, EMR, EFX, EL, EVRG, EVH, FFIV, FDS, FICO, FARO, FAST, FE, FLS, FMC, FTV, FNV, GMS, GS, GOOGL, GPRO, GGG, GES, HBI, HTLD, HELE, HSY, HOLX, HON, DHI, HOV, HUBG, IEX, INCY, INFN, INTC, IPAR, NVTA, IRM, JAZZ, KLAC, LH, LRCX, MTSI, MANH, MCHX, MKTX, MA, MSFT, ^IXIC, NOV, NFLX, NTAP, NJR, NEE, NI, JWN, NOVT, NVDA, OGE, ORI, OMC, ORCL, OR, OXM, PKE, PATK, PDCO, PAYX, PYPL, PRFT, PNW, POR, PINC, PGR, PEG, QTWO, QCOM, DGX, REGN, RGS, RNG, ROK, ROL, ROP, ROST, RGLD, R, ^GSPC, SAND, SLB, SMG, SEE, SEIC, SRE, SMTC, NOW, SLGN, STR, SO, SCCO, LUV, SWX, SR, SXI, SUM, SRDX, SNPS, TGT, TECH, TDY, TPX, TER, TXT, TMO, TDG, TWLO, UHAL, SLCA, UPS, VMI, VEEV, VRSN, WMT, WSO, WPM, WSC, WOLF, WWD, XEL, ZBRA, IYM, IYC, ITB, IHE, IDU, FTEC, QTEC, FXL, FXI, BOTZ, QQQ, ICF, IYH, IHF, IYZ, MXI, IXN, SOXX, IYF, EWO, EWK, EWC, EEM, EWH, EIS, EWM, EPP, EZA, EWP, EWD, EWT, TUR, QLD, IBB, PEJ, PJP, SSO, ROBO, XLF, GLD, XLV, XRT, SPY, XLK, XLU, USO, SMH, VIS, MGK, VONG. Click this link for details (pattern type, start and end dates).
For a list of small patterns (those a few days wide) click this link.
$ $ $
The following table shows where Fibonacci retrace values of the day's high-low range are plus pivot points, calculated on the Nasdaq composite, sorted by value. When several are near each other (small differences), the area might act as support or resistance.
-- Thomas Bulkowski
![]()
| © 2024 ThePatternSite.com Metric | Value | Diff | Close (within 10% of the high-low range for the day)? |
| Monthly S2 | 14,256.75 | ||
| Weekly S2 | 14,561.63 | 304.88 | |
| Monthly S1 | 14,869.34 | 307.70 | |
| Weekly S1 | 15,021.78 | 152.44 | |
| Monthly Pivot | 15,090.15 | 68.38 | |
| Weekly Pivot | 15,166.37 | 76.22 | |
| Daily S2 | 15,366.47 | 200.10 | |
| Daily S1 | 15,424.20 | 57.72 | |
| Low | 15,468.91 | 44.71 | |
| Close | 15,481.92 | 13.01 | Yes! The Close is close to the Low. |
| Daily Pivot | 15,526.63 | 44.71 | |
| 61.8% Down from Intraday High | 15,530.09 | 3.46 | Yes! The 61.8% Down from Intraday High is close to the Daily Pivot. |
| 50% Down from Intraday High | 15,548.99 | 18.90 | |
| Open | 15,560.61 | 11.62 | Yes! The Open is close to the 50% Down from Intraday High. |
| 38.2% Down from Intraday High | 15,567.89 | 7.28 | Yes! The 38.2% Down from Intraday High is close to the Open. |
| Daily R1 | 15,584.36 | 16.47 | |
| Weekly R1 | 15,626.52 | 42.16 | |
| High | 15,629.07 | 2.55 | Yes! The High is close to the Weekly R1. |
| Daily R2 | 15,686.79 | 57.72 | |
| Monthly R1 | 15,702.74 | 15.94 | Yes! The Monthly R1 is close to the Daily R2. |
| Weekly R2 | 15,771.11 | 68.38 | |
| Monthly R2 | 15,923.55 | 152.44 |
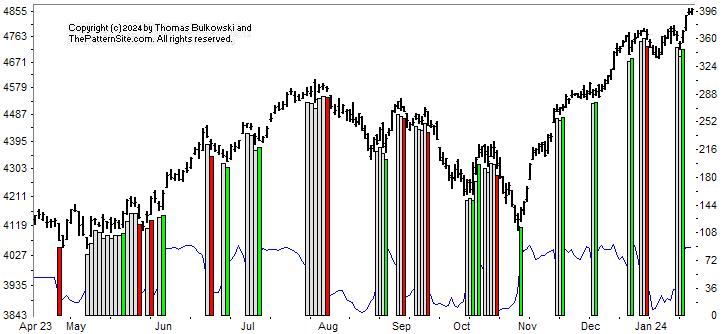
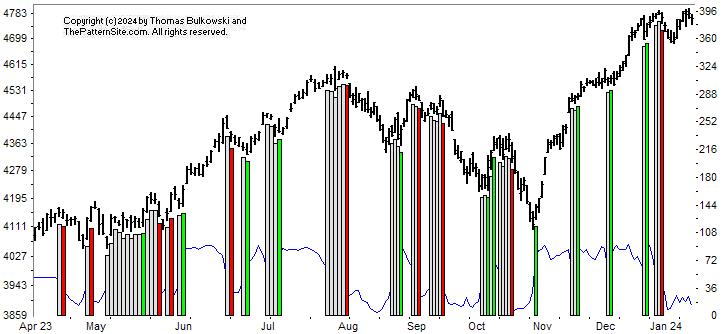
This is a picture of the chart pattern indicator on the daily scale. The indicator is the line chart below a chart of the S&P 500 composite.
The CPI turned green, which is bullish. It's at 90, which is close to the top of the range, which is 100.
Earnings will be coming out soon, so that'll likely bounce things around.
The red line is the percentage of stocks at least 20% below their 1-year high (plotted upside down). The blue line is the average percentage drop of stocks below their 1-year high (plotted upside down).
On Tuesday, 30% of stocks in my database are in bear market territory (down at least 20% from their 1-year high).A week ago, it was 32%.The fewest was 26% on 12/26/2023.And the most was 56% on 10/27/2023.
The 517 stocks in my database are down an average of 15% from their yearly high.A week ago, the average was 16%.The peak was 13% on 12/26/2023.And the bottom was 25% on 10/27/2023.
Both the red and blue lines are higher (better) than they were a week ago. Of course, the lines follow index like puppies.
The index is making new highs but notice that both the red and blue lines are below their highs. I'm not sure what it means, though.
Both charts are bullish but I view this cautiously. It looks to me like the upward momentum will falter and the uptrend will end.
$ $ $
Here's a symbol list of 146 chart and candlestick patterns (13 "investment grade" candle patterns) found in today's securities using my version of Patternz: ADTN, ALK, ALB, ALGT, AMED, AEO, AEL, AFG, AIG, AMN, APA, APOG, ARCB, AVA, AXS, BCPC, BALL, BAX, BECN, BERY, BA, BKNG, BOOT, BCO, BRKR, BBW, CBT, CPB, CINF, CSCO, CNO, CGNX, CTSH, CAG, CXW, CR, CTS, XRAY, DVN, DSGR, BOOM, EMN, EIX, FDS, FAST, FLS, FMC, FORM, FTNT, FWRD, FCX, FRD, GME, GD, GNW, GMS, GGG, GES, HOLX, HOV, HUBG, HUN, IDA, IIIN, INTC, KALU, KLIC, LXU, MANH, MA, MLKN, MYGN, NTGR, NKE, JWN, NUS, ORI, OXM, PKG, PDCO, PAYX, PYPL, PINC, RTX, RGS, ROK, ROL, SAND, SLB, SAIC, SEIC, SMTC, SLGN, SKX, LUV, SXI, SUM, SNPS, TPX, TDC, TER, TEVA, TMO, TJX, TOL, RIG, TZOO, TG, UHAL, VMI, WMT, WSO, WLK, WEX, WSC, WOLF, WWW, IYM, IYK, IHE, ICF, IAT, IYZ, IXN, ILF, EWK, EWZ, EWI, THD, DBA, PJP, ROBO, SMH. Click this link for details (pattern type, start and end dates).
For a list of small patterns (those a few days wide) click this link.
-- Thomas Bulkowski
![]()
$ $ $
I show another slider trading quiz featuring Pipe bottoms.
$ $ $
Here's a symbol list of 212 chart and candlestick patterns (13 "investment grade" candle patterns) found in today's securities using my version of Patternz: ANF, ACN, AEIS, AKAM, DOX, AEP, AMWD, AMN, APOG, AAPL, AMAT, ARCB, ADM, ANET, AGO, ADSK, AXS, BMI, BCPC, BAX, BKNG, BSX, BCO, BR, BLDR, BG, CDNS, COR, CENX, CDAY, CINF, CSCO, CNO, ED, CONN, COP, CXW, CRH, CTS, CMI, ^DJT, D, DUK, EXP, EIX, EMR, FFIV, FDX, FISV, FIVN, FLS, FORM, FTV, FCX, FDP, IT, GNW, GMS, GS, GPRO, GGG, GES, HIG, HQY, HTLD, HNI, HOLX, HUBG, IDA, INCY, INFN, IBP, PODD, INTU, KEYS, KFRC, KLAC, KSS, KLIC, RAMP, MHO, MTSI, M, MANH, MCHX, MAS, MA, MU, MSFT, MLI, MYGN, ^IXIC, NOV, NTAP, NWL, ORI, OMC, ASGN, OR, PANW, PATK, PAYX, PEN, PRFT, PNW, PPL, PHM, PSTG, QTWO, QCOM, DGX, RNG, ROK, R, ^GSPC, SAIA, SEIC, SKX, LUV, SPLK, SPSC, SXI, SUM, SNPS, TDOC, TPX, TDC, TER, TEVA, TXN, TXT, TTD, TKR, TJX, TREX, UIS, VECO, VRTX, VMC, WPM, XEL, IAI, IYC, ITB, IEZ, IHE, FTEC, FDN, QTEC, FXL, BOTZ, IYZ, IGV, IXN, SLV, IGE, IHI, EWG, EWH, EWJ, EWW, EZA, EWP, EWT, IBB, PPA, PJP, PHO, SSO, ROBO, XLE, XHB, XLI, SPY, XLK, UNG, USO, VIS, VONG. Click this link for details (pattern type, start and end dates).
For a list of small patterns (those a few days wide) click this link.
$ $ $
The following table shows where Fibonacci retrace values of the day's high-low range are plus pivot points, calculated on the Dow industrials, sorted by value. When several are near each other (small differences), the area might act as support or resistance.
-- Thomas Bulkowski
![]()
| © 2024 ThePatternSite.com Metric | Value | Diff | Close (within 10% of the high-low range for the day)? |
| Monthly S2 | 36,808.84 | ||
| Weekly S2 | 36,875.38 | 66.55 | |
| Monthly S1 | 37,405.32 | 529.94 | |
| Weekly S1 | 37,438.60 | 33.27 | |
| Monthly Pivot | 37,669.53 | 230.93 | |
| Weekly Pivot | 37,686.16 | 16.64 | Yes! The Weekly Pivot is close to the Monthly Pivot. |
| Daily S2 | 37,809.95 | 123.79 | |
| Daily S1 | 37,905.88 | 95.93 | |
| Low | 37,911.61 | 5.73 | Yes! The Low is close to the Daily S1. |
| Open | 37,919.55 | 7.94 | Yes! The Open is close to the Low. |
| 61.8% Down from Intraday High | 37,987.09 | 67.54 | |
| Close | 38,001.81 | 14.72 | Yes! The Close is close to the 61.8% Down from Intraday High. |
| Daily Pivot | 38,007.54 | 5.73 | Yes! The Daily Pivot is close to the Close. |
| 50% Down from Intraday High | 38,010.41 | 2.87 | Yes! The 50% Down from Intraday High is close to the Daily Pivot. |
| 38.2% Down from Intraday High | 38,033.72 | 23.31 | |
| Daily R1 | 38,103.47 | 69.75 | |
| High | 38,109.20 | 5.73 | Yes! The High is close to the Daily R1. |
| Daily R2 | 38,205.13 | 95.93 | |
| Weekly R1 | 38,249.38 | 44.25 | |
| Monthly R1 | 38,266.01 | 16.64 | Yes! The Monthly R1 is close to the Weekly R1. |
| Weekly R2 | 38,496.94 | 230.93 | |
| Monthly R2 | 38,530.21 | 33.27 |
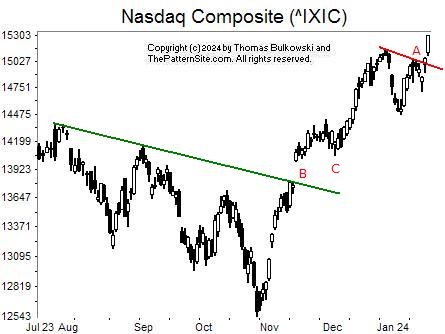
I show the Nasdaq composite on the daily scale.
At B, we see the index gap above a down-sloping trendline. It attempted to throwback (return) to the trendline (C), but it wasn't a serious attempt.
That spoke of underlying power in the move higher.
At A, we see the index has made a strong advance and closed above the prior peak and above a red line connecting the two recent peaks.
This isn't a busted double top in the strict sense of the phrase (because price has to confirm the pattern and drop no more than 10% below the valley between the two peaks before closing above the top of the pattern).
Regardless, it's a bullish move. So I'm looking for the index to continue moving higher but finding weakness in the first half of February, based on historical trends.
![]()
The following is a brief review of how the markets performed over time. The numbers refer to the close-to-close move in the Dow industrials.
No options expire this week.
![]()
The following is based on an SFO article in December 2004 by John Seekinger, titled, "Take a two-dimensional approach." He offers these tips.
| Index | S2 | S1 | Pivot | R1 | R2 |
| Dow Industrials (^DJI): Daily | 37,268 | 37,566 | 37,750 | 38,048 | 38,232 |
| Weekly | 36,829 | 37,347 | 37,640 | 38,157 | 38,451 |
| Monthly | 36,763 | 37,313 | 37,624 | 38,174 | 38,484 |
| S&P500 (^GSPC): Daily | 4,766 | 4,803 | 4,822 | 4,859 | 4,879 |
| Weekly | 4,672 | 4,756 | 4,799 | 4,883 | 4,926 |
| Monthly | 4,628 | 4,734 | 4,788 | 4,894 | 4,948 |
| Nasdaq (^IXIC): Daily | 15,013 | 15,162 | 15,236 | 15,386 | 15,460 |
| Weekly | 14,505 | 14,908 | 15,109 | 15,513 | 15,714 |
| Monthly | 14,200 | 14,755 | 15,033 | 15,589 | 15,867 |
Here are the formulas:
![]()
Earnings season is either underway or should be starting soon. The sessions could be more volatile.
Here's a symbol list of 159 chart and candlestick patterns (13 "investment grade" candle patterns) found in today's securities using my version of Patternz: ABT, AXDX, ACN, AES, AFL, A, ALL, AEO, AEP, AEL, ANIK, AR, AMAT, ACGL, ADM, ANET, ASH, AGO, ADSK, BALL, BAX, BKNG, BSX, CDNS, CALM, COR, CNC, CENX, CRL, CHKP, CINF, CLF, CLX, CNA, CGNX, CCRN, CCK, DHR, DFS, D, DUK, EXP, EIX, EME, EL, EG, FFIV, FORM, FTNT, FDP, IT, GOOGL, GGG, THG, HIG, HSY, INCY, INFN, NVTA, K, KLAC, LRCX, RAMP, L, LPLA, M, MANH, MDC, META, MSFT, MYGN, ^IXIC, NKE, ORI, ON, ORCL, OR, PAYX, PEN, PRFT, PETS, PNW, PPG, PSTG, QCOM, DGX, RGA, RLI, ROK, ROL, ROST, SAND, SRE, SMTC, SHOP, LUV, SWX, SPLK, SXI, SCS, SUM, TER, TXN, TRV, TZOO, TG, WRB, WPM, WSC, WDAY, XEL, IYK, IHE, FTEC, FDN, QTEC, FXL, BOTZ, QQQ, IGV, IXN, SOXX, EWY, EWT, TUR, QLD, PJP, XLP, XLB, XRT, XLK, UNG, SMH, MGK, VONG. Click this link for details (pattern type, start and end dates).
For a list of small patterns (those a few days wide) click this link.
The below industries were the best (rank 1) or worst performing of those I follow.
|
-- Thomas Bulkowski
![]()
$ $ $
Here's a symbol list of 161 chart and candlestick patterns (13 "investment grade" candle patterns) found in today's securities using my version of Patternz: ANF, AXDX, ACN, AFL, AA, AEE, AEO, AEP, AIG, ANIK, AR, ASH, AVNT, BAX, BMRN, BOOT, BSX, BFH, CDNS, COR, CENX, CLNE, CLF, CMTL, CRH, DFS, ^DJT, D, DOV, DTE, DUK, EXP, EIX, EVH, FFIV, FICO, FAST, FWRD, FDP, GPS, IT, GPN, GOOGL, GPRO, GGG, THG, HQY, HTLD, HL, HOLX, HOV, HUM, JBHT, INCY, INFN, IBP, IIIN, ITGR, IPAR, NVTA, KFRC, KLAC, KSS, LZB, LH, LRCX, LAMR, RAMP, LMT, L, M, MGY, MANH, MCHX, MLM, MU, MSFT, MYGN, NFG, NEE, NKE, JWN, NWPX, ORCL, OR, OUT, PANW, PKE, PAYX, PEN, PRFT, PETS, PFE, PNW, PFG, DGX, RRC, RTX, ROK, ROST, RGLD, SAIA, CRM, NOW, SLGN, LUV, SWN, SR, TER, UGI, UNH, UNM, VECO, WPM, XEL, IYE, IHE, FTEC, BOTZ, IHF, IAT, IXC, IXN, SOXX, SLV, IGE, IEO, EWZ, EWM, TUR, PJP, XLB, XRT, XLK, SMH, MGK. Click this link for details (pattern type, start and end dates).
For a list of small patterns (those a few days wide) click this link.
$ $ $
You can find setups based on a Fibonacci retrace by clicking on the link.
The following patterns were found manually, not using Patternz. Mr. Bulkowski has excluded any securities he owns from appearing in the list. However, he may add any of the securities listed to his portfolio at any time, just as you can.
In the table below, the red and green colors are based on the historical breakout direction for the associated chart pattern. If a high and tight flag appears, the start and end dates highlight the flagpole only and not the flag.
For details about the chart patterns, click here.
-- Thomas Bulkowski
![]()
| Symbol | Chart Pattern | Bullish Bearish | Start | End | Industry |
| AXDX | Dead-cat bounce | 01/16/2024 | 01/16/2024 | Medical Services | |
| AFG | Double Top, Adam and Adam | 12/14/2023 | 01/05/2024 | Insurance (Prop/Casualty) | |
| AON | Double Bottom, Eve and Adam | 12/20/2023 | 01/05/2024 | Insurance (Diversified) | |
| BMY | Double Top, Adam and Adam | 12/22/2023 | 01/02/2024 | Drug | |
| CDNS | Pipe bottom | 01/02/2024 | 01/08/2024 | Computer Software and Svcs | |
| CPB | Triangle, symmetrical | 12/06/2023 | 01/18/2024 | Food Processing | |
| CHD | Ugly double bottom | 11/03/2023 | 12/15/2023 | Household Products | |
| D | Pipe top | 01/02/2024 | 01/08/2024 | Electric Utility (East) | |
| EMN | Double Top, Adam and Eve | 12/14/2023 | 12/26/2023 | Chemical (Diversified) | |
| EBAY | Triple top | 12/19/2023 | 01/02/2024 | Internet | |
| ELV | Double Top, Adam and Adam | 12/13/2023 | 01/04/2024 | Medical Services | |
| FDP | Pipe top | 01/02/2024 | 01/08/2024 | Food Processing | |
| GPS | Triple top | 12/11/2023 | 01/09/2024 | Apparel | |
| HBI | Head-and-shoulders top | 12/14/2023 | 01/12/2024 | Apparel | |
| HLIT | Head-and-shoulders top | 12/21/2023 | 01/08/2024 | Telecom. Equipment | |
| HSIC | Head-and-shoulders top | 12/15/2023 | 01/09/2024 | Medical Supplies | |
| IDXX | Triple top | 12/14/2023 | 01/12/2024 | Drug | |
| INCY | Pipe top | 01/02/2024 | 01/08/2024 | Drug | |
| LHX | Double Top, Eve and Eve | 12/20/2023 | 01/02/2024 | Aerospace/Defense | |
| LZB | Head-and-shoulders top | 12/04/2023 | 01/10/2024 | Furn/Home Furnishings | |
| LANC | Double Bottom, Eve and Eve | 12/21/2023 | 01/05/2024 | Food Processing | |
| MANH | Pipe bottom | 01/08/2024 | 01/08/2024 | IT Services | |
| MOS | Head-and-shoulders top | 11/16/2023 | 01/03/2024 | Chemical (Diversified) | |
| NWL | Double Top, Adam and Eve | 12/14/2023 | 01/09/2024 | Household Products | |
| NI | Double Top, Adam and Adam | 12/14/2023 | 01/10/2024 | Electric Utility (Central) | |
| OUT | Double Top, Eve and Adam | 12/27/2023 | 01/12/2024 | Advertising | |
| PCG | Head-and-shoulders complex top | 11/20/2023 | 01/10/2024 | Electric Utility (West) | |
| PNW | Pipe top | 01/02/2024 | 01/08/2024 | Electric Utility (West) | |
| POR | Double Top, Adam and Eve | 12/14/2023 | 01/05/2024 | Electric Utility (West) | |
| PINC | Triple top | 12/22/2023 | 01/08/2024 | Healthcare Information | |
| DGX | Pipe top | 01/02/2024 | 01/08/2024 | Medical Services | |
| RLI | Ugly double bottom | 12/15/2023 | 01/09/2024 | Insurance (Prop/Casualty) | |
| R | Pipe top | 12/18/2023 | 12/26/2023 | Trucking/Transp. Leasing | |
| SIGI | Double Bottom, Adam and Adam | 12/21/2023 | 01/09/2024 | Insurance (Prop/Casualty) | |
| TXN | Head-and-shoulders top | 12/15/2023 | 01/09/2024 | Semiconductor | |
| VEEV | Pipe bottom | 11/06/2023 | 11/13/2023 | Healthcare Information | |
| WPM | Head-and-shoulders top | 12/01/2023 | 01/12/2024 | Metals and Mining (Div.) | |
| XLK | Pipe bottom | 01/02/2024 | 01/08/2024 | IT Services |
![]()
Since I post this the night before, check how the futures are trading before market open. Large moves can affect the opening direction.
$ $ $
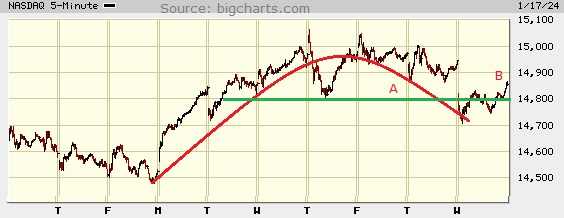
I show a picture of the Nasdaq composite on the 5-minute scale.
The red line (A) outlines the form of an inverted and ascending scallop chart pattern. Of course the image is far from ideal (with the red line showing how smooth the turn could be). Indeed, it's almost unrecognizable as a chart pattern.
The green line shows areas of resistance against an upward move. However, at B, the resistance didn't slow the recovery.
What this suggests is that the upward move will continue but with caution. Overhead resistance could block the advance.
$ $ $
Here's a symbol list of 235 chart and candlestick patterns (13 "investment grade" candle patterns) found in today's securities using my version of Patternz: DDD, AXDX, ACN, ADBE, AFL, ALK, AA, ALGT, AMZN, AEP, AMWD, ANIK, AR, APA, ACGL, ASH, ADSK, AVNT, AXS, BALL, BAX, BZH, BFH, BCO, CBT, CDNS, CLS, COR, CENX, CRL, CHKP, CLF, CLX, CMCO, CMTL, CONN, GLW, COST, COTY, CR, CCRN, CTS, XRAY, DVN, FANG, D, DOV, EXP, EMN, EIX, ELV, EMR, EOG, EQT, EL, FFIV, FICO, FAST, FLEX, FMC, FORM, FTV, FWRD, FCX, FDP, GPS, IT, GFS, HBI, HAYN, HL, HSII, HELE, HNI, HOLX, ILMN, INCY, INFN, NSP, IBKR, TILE, NVTA, IRM, KALU, KSS, LZB, LANC, LLY, RAMP, M, MANH, MRO, MTDR, MTRN, MDT, MRCY, MS, MLI, MUR, MYGN, NFG, NEE, NKE, NOVT, OMCL, ON, OTEX, ORCL, OR, OUT, OMI, PKE, PTEN, PYPL, PEN, PRFT, PETS, PFE, PNW, PLXS, PSTG, KWR, DGX, REGN, ROK, RCKY, ROG, RGLD, RES, SAIA, CRM, SAND, SMTC, SLGN, STR, SMAR, SCCO, SR, SPSC, SUM, SRDX, TRGP, TDOC, TER, TXT, TDG, SLCA, UGI, UPS, VFC, VLO, WSO, WERN, WPM, WOLF, WWW, XEL, IYM, IHE, QTEC, FXI, BOTZ, IAT, IEV, IGV, IXC, MXI, ILF, IGE, IEO, EWA, EWO, EWK, EWZ, EWC, ECH, EEM, EWQ, EWG, EWH, EWI, EWM, EWW, EPP, EWS, EZA, EWY, EWP, EWD, EWL, EWT, THD, EWU, QLD, IBB, PEJ, PJP, ROBO, XLY, XLB, XRT, XLK, SMH, VAW. Click this link for details (pattern type, start and end dates).
For a list of small patterns (those a few days wide) click this link.
$ $ $
The following table shows where Fibonacci retrace values of the day's high-low range are plus pivot points, calculated on the Nasdaq composite, sorted by value. When several are near each other (small differences), the area might act as support or resistance.
-- Thomas Bulkowski
![]()
| © 2024 ThePatternSite.com Metric | Value | Diff | Close (within 10% of the high-low range for the day)? |
| Monthly S2 | 13,871.77 | ||
| Weekly S2 | 14,323.07 | 451.29 | |
| Monthly S1 | 14,363.70 | 40.63 | |
| Weekly S1 | 14,589.34 | 225.65 | |
| Daily S2 | 14,649.67 | 60.33 | |
| Low | 14,706.23 | 56.56 | |
| Daily S1 | 14,752.65 | 46.42 | |
| Monthly Pivot | 14,756.88 | 4.24 | Yes! The Monthly Pivot is close to the Daily S1. |
| 61.8% Down from Intraday High | 14,767.17 | 10.29 | Yes! The 61.8% Down from Intraday High is close to the Monthly Pivot. |
| 50% Down from Intraday High | 14,786.00 | 18.82 | |
| 38.2% Down from Intraday High | 14,804.82 | 18.82 | |
| Daily Pivot | 14,809.20 | 4.38 | Yes! The Daily Pivot is close to the 38.2% Down from Intraday High. |
| Open | 14,814.77 | 5.57 | Yes! The Open is close to the Daily Pivot. |
| Weekly Pivot | 14,826.48 | 11.71 | Yes! The Weekly Pivot is close to the Open. |
| Close | 14,855.62 | 29.14 | |
| High | 14,865.76 | 10.14 | Yes! The High is close to the Close. |
| Daily R1 | 14,912.18 | 46.42 | |
| Daily R2 | 14,968.73 | 56.56 | |
| Weekly R1 | 15,092.75 | 124.02 | |
| Monthly R1 | 15,248.81 | 156.05 | |
| Weekly R2 | 15,329.89 | 81.08 | |
| Monthly R2 | 15,641.99 | 312.11 |
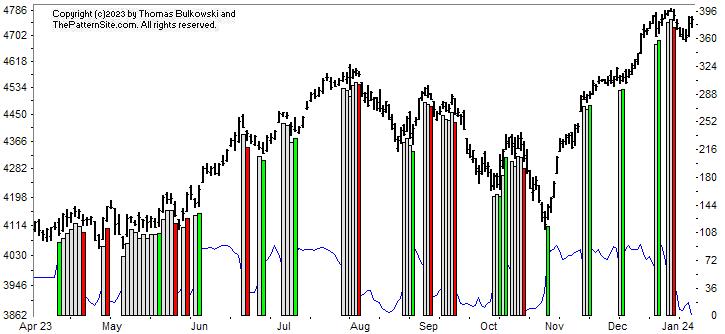
This is a picture of the chart pattern indicator on the daily scale. The indicator is the line chart below a chart of the S&P 500 composite.
The chart pattern we see in the index is an unconfirmed double top. That's a twin peak pattern that isn't valid until price closes below the valley between the two peaks.
If it confirms, then expect the index to continue lower. Until then, anything can happen.
Near the bottom of the chart is the CPI line. It's hovering near 18 with 0 as the lowest it can go. It suggest weakness. The pattern on that blue line reminds me of a measured move up. It suggests a rise to 36 before it drops back down. But that's a guess.
The red line is the percentage of stocks at least 20% below their 1-year high (plotted upside down). The blue line is the average percentage drop of stocks below their 1-year high (plotted upside down).
On Tuesday, 32% of stocks in my database are in bear market territory (down at least 20% from their 1-year high).A week ago, it was 26%.The fewest was 26% on 12/26/2023.And the most was 56% on 10/27/2023.
The 517 stocks in my database are down an average of 16% from their yearly high.A week ago, the average was 15%.The peak was 13% on 12/26/2023.And the bottom was 25% on 10/27/2023.
Since mid December, see the rounded turn by the red line. It's heading down now, confirmed by the above readings. Both lines are worse today compared to a week ago.
Both charts are bearish but the CPI suggests we might see price move higher before dropping again. I'm going to wait longer for a bigger drop, which I believe is coming.
$ $ $
Here's a symbol list of 204 chart and candlestick patterns (13 "investment grade" candle patterns) found in today's securities using my version of Patternz: DDD, ANF, ABM, AXDX, ACIW, AMD, ATSG, ALK, AA, ALKS, ALGT, AMZN, AXP, AMGN, AMN, APA, AAPL, ARW, ASH, AVNT, AXS, BALL, BAX, BERY, BKH, BA, BOOT, BFH, CDNS, CAL, CE, COR, CENX, CHKP, CIEN, CINF, CSCO, CLF, CMCO, CAG, CXW, GLW, DOV, EXP, EMN, EBAY, EOG, EL, EG, EXPI, FAST, FISV, FMC, FORM, FTV, FWRD, FCX, GME, GPS, GFS, HBI, HLIT, HELE, HOLX, HUN, IEX, IDXX, ILMN, INFN, IBKR, TILE, IPG, NVTA, KBH, KEYS, KSS, LRCX, LEN, LLY, LMT, LXU, MTSI, M, MRTN, MDC, MRCY, MSFT, MLKN, MCO, MS, MYGN, NFG, NTGR, NJR, NOVT, OLN, OTEX, OMI, PTEN, PEN, PFE, PNW, POR, PFG, PG, RMBS, ROK, ROP, SMTC, SLGN, SKYW, SCCO, SWX, SR, SXI, SSYS, SRDX, SNPS, TDOC, TPX, TTD, TOL, RIG, TZOO, SLCA, UGI, UPS, VFC, VLO, V, WSO, WERN, WPM, WSC, WOLF, ZBRA, ITA, IYM, IYC, ITB, IEZ, IHE, FTEC, FXI, IYZ, IEV, MXI, IXN, IYF, EWA, EWO, EWK, EWZ, EWC, ECH, EWG, EWH, EWM, EWY, EWD, EWL, EWT, TUR, EWU, IBB, PBE, PEJ, PJP, XHB, XLI, XLB, XRT, XLK, SMH, VIS, VAW. Click this link for details (pattern type, start and end dates).
For a list of small patterns (those a few days wide) click this link.
-- Thomas Bulkowski
![]()
$ $ $
I show another slider trading quiz featuring Triple bottoms.
$ $ $
Here's a symbol list of 161 chart and candlestick patterns (13 "investment grade" candle patterns) found in today's securities using my version of Patternz: MMM, ABM, ACN, ACIW, AYI, AEIS, ALK, AA, AMZN, DOX, AEE, AXP, ARW, ASH, ADSK, AXS, BSET, BAX, BZH, BIG, BIO, BKH, BA, BKNG, BFH, COR, CF, CHKP, CIEN, CINF, CTSH, CL, CXW, GLW, COST, CW, DVN, DFS, DOV, EXP, EIX, EPAM, EL, EG, EVRG, EZPW, FFIV, FICO, FDP, GD, GNW, GILD, GGG, HIG, HE, HL, HELE, HP, HUM, IDA, IDXX, ILMN, IIIN, PODD, IPG, NVTA, JAZZ, KALU, KBH, KMT, LHX, LANC, LEN, LLY, RAMP, LOW, LXU, MRTN, MAS, MDC, META, MLKN, MLI, NFG, NEU, NOC, NOVT, OTEX, OUT, OXM, PNW, PLXS, POR, PPL, PFG, PG, PSTG, REGN, RLI, ROK, ROG, SEIC, SMTC, SR, SSYS, SNPS, TPR, TGT, TPX, TDC, TER, TKR, TOL, UPS, UNM, VMI, MDRX, VRTX, VC, WSO, WEX, WPM, WSC, WOLF, XEL, ZBRA, IYC, ITB, IHE, FXL, FXI, MXI, SOXX, SLV, EWZ, EWC, EWH, EWJ, EPP, TUR, EWU, DBA, PBE, PJP, XHB, XAR, USO, SMH. Click this link for details (pattern type, start and end dates).
For a list of small patterns (those a few days wide) click this link.
$ $ $
The following table shows where Fibonacci retrace values of the day's high-low range are plus pivot points, calculated on the Dow industrials, sorted by value. When several are near each other (small differences), the area might act as support or resistance.
-- Thomas Bulkowski
![]()
| © 2024 ThePatternSite.com Metric | Value | Diff | Close (within 10% of the high-low range for the day)? |
| Monthly S2 | 35,396.33 | ||
| Monthly S1 | 36,494.66 | 1,098.32 | |
| Weekly S2 | 36,979.80 | 485.14 | |
| Monthly Pivot | 37,159.96 | 180.16 | |
| Daily S2 | 37,274.40 | 114.43 | |
| Weekly S1 | 37,286.39 | 11.99 | Yes! The Weekly S1 is close to the Daily S2. |
| Daily S1 | 37,433.69 | 147.30 | |
| Low | 37,470.19 | 36.50 | |
| Weekly Pivot | 37,555.83 | 85.64 | |
| Close | 37,592.98 | 37.15 | |
| 61.8% Down from Intraday High | 37,605.83 | 12.85 | Yes! The 61.8% Down from Intraday High is close to the Close. |
| Daily Pivot | 37,629.48 | 23.65 | Yes! The Daily Pivot is close to the 61.8% Down from Intraday High. |
| 50% Down from Intraday High | 37,647.73 | 18.25 | Yes! The 50% Down from Intraday High is close to the Daily Pivot. |
| 38.2% Down from Intraday High | 37,689.63 | 41.90 | |
| Daily R1 | 37,788.77 | 99.14 | |
| Open | 37,818.05 | 29.28 | Yes! The Open is close to the Daily R1. |
| High | 37,825.27 | 7.22 | Yes! The High is close to the Open. |
| Weekly R1 | 37,862.42 | 37.15 | |
| Daily R2 | 37,984.56 | 122.14 | |
| Weekly R2 | 38,131.86 | 147.30 | |
| Monthly R1 | 38,258.29 | 126.43 | |
| Monthly R2 | 38,923.59 | 665.31 |
$ $ $
Here's a symbol list of 113 chart and candlestick patterns (13 "investment grade" candle patterns) found in today's securities using my version of Patternz: AYI, ALRM, AEP, ARCB, ARW, AXS, BALL, BAX, BBY, BIG, BA, CLS, COR, CNC, CINF, CLNE, CMCO, ED, CCK, EXP, EPAM, FFIV, FARO, FWRD, GD, GNW, HE, HSII, HOLX, IDA, INFN, IPG, NVTA, JNJ, LHX, LLY, MGY, MCHX, MKTX, MSFT, MS, MOS, MYGN, NFLX, NKE, ORI, OLN, ORCL, PANW, PTEN, PCTY, PETS, PNW, POR, PPL, KWR, DGX, ROK, ROL, ROST, SBH, SCHW, SEIC, NOW, SHW, STR, SO, SR, SPLK, SNPS, TGT, TTD, RIG, TG, SLCA, UPS, UNH, WOLF, WWD, XEL, ZBRA, IEZ, IHE, IDU, IYZ, IEV, SLV, EWA, ECH, EEM, EWM, EPP, EWY, TUR, EWU, IBB, PBE, PJP, XLB, XAR, UNG, USO, VAW. Click this link for details (pattern type, start and end dates).
For a list of small patterns (those a few days wide) click this link.
$ $ $
You can find setups based on a Fibonacci retrace by clicking on the link.
The following patterns were found manually, not using Patternz. Mr. Bulkowski has excluded any securities he owns from appearing in the list. However, he may add any of the securities listed to his portfolio at any time, just as you can.
In the table below, the red and green colors are based on the historical breakout direction for the associated chart pattern. If a high and tight flag appears, the start and end dates highlight the flagpole only and not the flag.
For details about the chart patterns, click here.
-- Thomas Bulkowski
![]()
| Symbol | Chart Pattern | Bullish Bearish | Start | End | Industry |
| AES | Triangle, symmetrical | 12/14/2023 | 01/10/2024 | Electric Utility (East) | |
| APD | Double Top, Eve and Eve | 12/18/2023 | 12/27/2023 | Chemical (Diversified) | |
| BSET | Head-and-shoulders top | 11/06/2023 | 12/27/2023 | Furn/Home Furnishings | |
| CACI | Double Bottom, Eve and Eve | 12/20/2023 | 01/04/2024 | IT Services | |
| CONN | Flag, high and tight | 12/07/2023 | 01/10/2024 | Retail (Special Lines) | |
| CW | Double Top, Adam and Eve | 12/13/2023 | 01/02/2024 | Machinery | |
| ^DJT | Double Top, Eve and Eve | 12/19/2023 | 12/22/2023 | None | |
| EXPD | Double Top, Eve and Eve | 12/26/2023 | 01/05/2024 | Air Transport | |
| GME | Double Top, Eve and Eve | 12/19/2023 | 12/27/2023 | Retail (Special Lines) | |
| HWM | Triangle, symmetrical | 12/14/2023 | 01/09/2024 | Aerospace/Defense | |
| IPG | Broadening top | 12/18/2023 | 01/11/2024 | Advertising | |
| MRO | Head-and-shoulders top | 12/18/2023 | 01/04/2024 | Petroleum (Integrated) | |
| MUR | Double Top, Adam and Eve | 12/01/2023 | 12/26/2023 | Petroleum (Integrated) | |
| NJR | Triple top | 12/14/2023 | 01/03/2024 | Natural Gas (Distributor) | |
| NVDA | Ugly double bottom | 10/31/2023 | 12/04/2023 | Semiconductor | |
| RLI | Pipe bottom | 12/11/2023 | 12/18/2023 | Insurance (Prop/Casualty) | |
| SMG | Head-and-shoulders top | 12/14/2023 | 01/08/2024 | Chemical (Basic) | |
| SHW | Double Top, Adam and Eve | 12/15/2023 | 12/29/2023 | Chemical (Basic) | |
| SWN | Head-and-shoulders bottom | 11/10/2023 | 01/04/2024 | Natural Gas (Diversified) | |
| VLO | Double Top, Adam and Adam | 12/20/2023 | 01/04/2024 | Petroleum (Integrated) | |
| XEL | Double Top, Adam and Eve | 12/14/2023 | 01/04/2024 | Electric Utility (West) |
![]()
Since I post this the night before, check how the futures are trading before market open. Large moves can affect the opening direction.
$ $ $
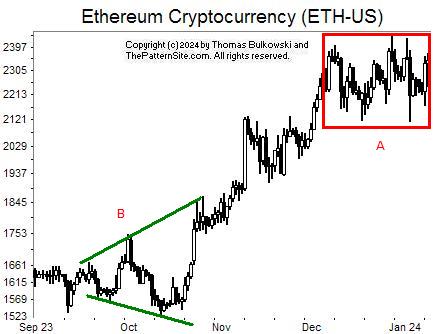
I show a picture of the Ethereum cryptocurrency on the daily scale.
There's not much to show on the chart. At A, these large price swings make me nervous, as if I think they will lead to a downward breakout. It might. However, I haven't done much research on this. My experience says that it won't. Bollinger bands will tell you that periods of low volatility follow periods of high volatility. That doesn't tell the direction, but it suggests it will be a strong trend upward or downward.
In green (B) is a broadening bottom or top. I can't tell in this chart.
$ $ $
Here's a symbol list of 119 chart and candlestick patterns (13 "investment grade" candle patterns) found in today's securities using my version of Patternz: ACN, AKAM, ALK, AMZN, AXP, APOG, AMAT, ADM, ARW, BAX, BIO, BKNG, BLDR, BG, CNC, CNP, CLNE, CNO, CMCO, COST, CR, CCRN, CTS, FANG, EXP, EXPD, FICO, FTNT, FWRD, IT, GMS, THG, HSY, HD, DHI, HWM, IBP, INTC, IPG, ISRG, JBLU, KBH, K, KMB, LHX, LEN, LLY, LOW, MGY, MDC, MRCY, META, MSFT, MOS, MUR, PANW, PCTY, PCG, PPG, PRU, PEG, PHM, DGX, RMBS, RHI, ROK, RES, SBH, SLB, SCHW, SIGI, NOW, SHOP, LUV, SR, SSYS, TEVA, TOL, RIG, TG, TREX, SLCA, VECO, WMT, WOLF, ZBRA, IEZ, IHE, BOTZ, IHF, IYZ, MXI, ILF, EEM, EWJ, EPP, EWS, EZA, EWY, TUR, IBB, PBE, PJP, XLF, XHB, USO. Click this link for details (pattern type, start and end dates).
For a list of small patterns (those a few days wide) click this link.
$ $ $
The following table shows where Fibonacci retrace values of the day's high-low range are plus pivot points, calculated on the Nasdaq composite, sorted by value. When several are near each other (small differences), the area might act as support or resistance.
-- Thomas Bulkowski
![]()
| © 2024 ThePatternSite.com Metric | Value | Diff | Close (within 10% of the high-low range for the day)? |
| Monthly S2 | 13,634.53 | ||
| Monthly S1 | 14,302.09 | 667.56 | |
| Weekly S2 | 14,368.11 | 66.02 | |
| Weekly S1 | 14,668.88 | 300.77 | |
| Monthly Pivot | 14,726.08 | 57.20 | |
| Weekly Pivot | 14,778.34 | 52.26 | |
| Daily S2 | 14,781.35 | 3.01 | Yes! The Daily S2 is close to the Weekly Pivot. |
| Low | 14,842.70 | 61.35 | |
| Daily S1 | 14,875.50 | 32.80 | |
| Open | 14,877.70 | 2.20 | Yes! The Open is close to the Daily S1. |
| 61.8% Down from Intraday High | 14,902.10 | 24.40 | |
| 50% Down from Intraday High | 14,920.45 | 18.35 | |
| Daily Pivot | 14,936.85 | 16.40 | |
| 38.2% Down from Intraday High | 14,938.80 | 1.95 | Yes! The 38.2% Down from Intraday High is close to the Daily Pivot. |
| Close | 14,969.65 | 30.85 | |
| High | 14,998.20 | 28.55 | |
| Daily R1 | 15,031.00 | 32.80 | |
| Weekly R1 | 15,079.11 | 48.11 | |
| Daily R2 | 15,092.35 | 13.24 | Yes! The Daily R2 is close to the Weekly R1. |
| Weekly R2 | 15,188.57 | 96.22 | |
| Monthly R1 | 15,393.64 | 205.07 | |
| Monthly R2 | 15,817.63 | 423.99 |
This is a picture of the chart pattern indicator on the daily scale. The indicator is the line chart below a chart of the S&P 500 composite.
The CPI remains bearish. If you look at the thin blue line near the bottom of the chart, it's at or near the 0 value, which is the lowest on the scale.
What does this mean? The signal is bearish and getting worse (more bearish). However, if you're an optimist, then the indictor doesn't tend to stay near 0 for too long.
This could mean the start of a measured move down pattern, starting with the first leg at the highest peak in the chart, moving down, retracing (going back up) and then resuming the second leg with another drop. You can think of this as a stair-step down pattern.
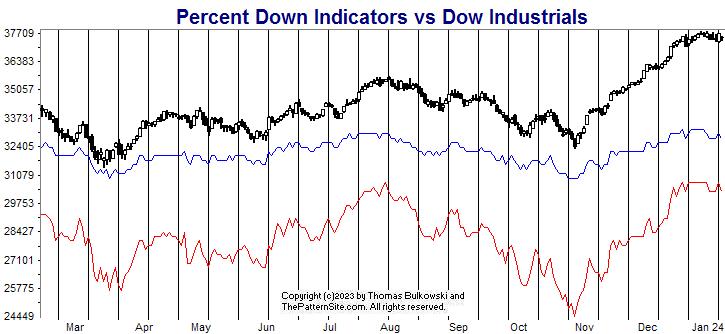
The red line is the percentage of stocks at least 20% below their 1-year high (plotted upside down). The blue line is the average percentage drop of stocks below their 1-year high (plotted upside down).
On Tuesday, 28% of stocks in my database are in bear market territory (down at least 20% from their 1-year high).A week ago, it was 26%.The fewest was 26% on 12/26/2023.And the most was 56% on 10/27/2023.
The 517 stocks in my database are down an average of 15% from their yearly high.A week ago, the average was 14%.The peak was 13% on 12/26/2023.And the bottom was 25% on 10/27/2023.
Both the red and blue lines are slightly worse this week compared to a week ago.
Both charts are bearish but it's not a strong push lower, I think. I expect the downtrend to continue but the CPI says a bounce upward might happen. So I'm not confident of the direction.
$ $ $
Here's a symbol list of 119 chart and candlestick patterns (13 "investment grade" candle patterns) found in today's securities using my version of Patternz: DDD, ABM, AXDX, ACN, AYI, AEIS, AFL, ALK, AIG, APA, ARW, AXS, BAX, CAL, CNC, CDAY, CVX, CIEN, CLNE, CLF, CNX, CGNX, CAG, COP, CXW, DVN, FANG, DRQ, EXP, EXPD, XOM, FNV, GME, GL, HBI, THG, HP, IDXX, ILMN, INCY, LHX, LANC, LPLA, MGY, MRO, MDT, MLKN, MUR, NBR, NTGR, NTAP, NWL, ASGN, PXD, PLXS, QTWO, RGA, RHI, ROK, ROG, ROP, ROST, RES, R, SBH, SAND, SLB, LUV, SR, SSYS, TFX, SLCA, VECO, WMT, WU, ZBRA, IYC, IYE, IEZ, IHE, FXI, IXC, MXI, SLV, IGE, IEO, ECH, EEM, EWH, EPP, EWY, EWD, TUR, PXJ, PJP, XLE, UNG. Click this link for details (pattern type, start and end dates).
For a list of small patterns (those a few days wide) click this link.
-- Thomas Bulkowski
![]()
$ $ $
I show another slider trading quiz featuring Head-and-shoulders bottoms.
$ $ $
Here's a symbol list of 153 chart and candlestick patterns (13 "investment grade" candle patterns) found in today's securities using my version of Patternz: DDD, ACN, ACIW, ADBE, ATSG, AKAM, ALK, AEO, AIG, AWI, AXS, BMI, BSET, BAX, BA, BOOT, BFH, BLDR, CNC, CDAY, CLNE, CLF, CONN, COST, CRH, CROX, CSGS, CTS, CMI, D, DRQ, EXP, EXPD, FFIV, FIVN, FTNT, FWRD, FDP, GPS, GMS, GS, HBI, THG, HQY, HP, HOLX, HD, HOV, JBHT, HUN, INFN, IBP, KMT, KLIC, LHX, LZB, LRCX, LANC, LEG, LEN, LOW, MTSI, MGY, MAN, MTRX, MCO, MUR, MYGN, NOV, NWL, NKE, NWPX, NTNX, OTEX, OUT, PKG, PTEN, PEN, PRFT, PETS, PNW, PLXS, POR, RMBS, ROK, RES, R, SBH, SAND, STR, SMAR, SO, SWN, SPSC, SNPS, TDY, TFX, TMO, TJX, TOL, TDG, UHAL, SLCA, UPS, UNH, WU, WPM, ZBRA, ITA, IYC, ITB, IEZ, IHE, FXI, ICF, IEV, MXI, EWH, EIS, EWJ, EWM, EPP, EWS, EZA, EWY, EWP, EWD, TUR, EWU, DBA, PBE, PXJ, PJP, PHO, GLD, XLI, XLB, VAW, MGK. Click this link for details (pattern type, start and end dates).
For a list of small patterns (those a few days wide) click this link.
$ $ $
The following table shows where Fibonacci retrace values of the day's high-low range are plus pivot points, calculated on the Dow industrials, sorted by value. When several are near each other (small differences), the area might act as support or resistance.
-- Thomas Bulkowski
![]()
| © 2024 ThePatternSite.com Metric | Value | Diff | Close (within 10% of the high-low range for the day)? |
| Monthly S2 | 35,253.55 | ||
| Monthly S1 | 36,468.28 | 1,214.73 | |
| Daily S2 | 37,098.04 | 629.76 | |
| Monthly Pivot | 37,129.18 | 31.14 | Yes! The Monthly Pivot is close to the Daily S2. |
| Weekly S2 | 37,132.71 | 3.53 | Yes! The Weekly S2 is close to the Monthly Pivot. |
| Low | 37,249.24 | 116.53 | |
| Open | 37,327.37 | 78.13 | |
| Daily S1 | 37,390.53 | 63.16 | |
| Weekly S1 | 37,407.86 | 17.33 | Yes! The Weekly S1 is close to the Daily S1. |
| 61.8% Down from Intraday High | 37,418.73 | 10.87 | Yes! The 61.8% Down from Intraday High is close to the Weekly S1. |
| 50% Down from Intraday High | 37,471.08 | 52.35 | |
| 38.2% Down from Intraday High | 37,523.43 | 52.36 | |
| Daily Pivot | 37,541.72 | 18.29 | Yes! The Daily Pivot is close to the 38.2% Down from Intraday High. |
| Weekly Pivot | 37,598.97 | 57.25 | |
| Close | 37,683.01 | 84.04 | |
| High | 37,692.92 | 9.91 | Yes! The High is close to the Close. |
| Daily R1 | 37,834.21 | 141.29 | |
| Weekly R1 | 37,874.12 | 39.91 | Yes! The Weekly R1 is close to the Daily R1. |
| Daily R2 | 37,985.40 | 111.28 | |
| Weekly R2 | 38,065.23 | 79.83 | |
| Monthly R1 | 38,343.91 | 278.68 | |
| Monthly R2 | 39,004.81 | 660.90 |
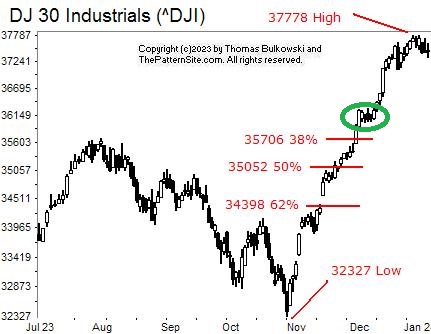
I show the Dow industrials on the daily scale.
I've highlighted the recent swing low and high values. Taking the Fibonacci values of that swing gives an indication of where the Dow might retrace. Keep in mind that I've proven that Fib retraces don't work.
To put it differently, price will retrace at common values of 38%, 50%, or 62% as often as they retrace any other number. I didn't see any value for a retrace where stocks would stop.
Circled in green is a knot where I think a retrace will stop. Of course, price has to get there first. We might see a drop that far in February, if the 2024 forecast (slide 4) is correct.
![]()
The following is a brief review of how the markets performed over time. The numbers refer to the close-to-close move in the Dow industrials.
No options expire this week.
![]()
The following is based on an SFO article in December 2004 by John Seekinger, titled, "Take a two-dimensional approach." He offers these tips.
| Index | S2 | S1 | Pivot | R1 | R2 |
| Dow Industrials (^DJI): Daily | 37,171 | 37,319 | 37,471 | 37,619 | 37,771 |
| Weekly | 37,060 | 37,263 | 37,527 | 37,730 | 37,993 |
| Monthly | 35,181 | 36,324 | 37,057 | 38,199 | 38,933 |
| S&P500 (^GSPC): Daily | 4,661 | 4,679 | 4,700 | 4,718 | 4,740 |
| Weekly | 4,639 | 4,668 | 4,711 | 4,740 | 4,783 |
| Monthly | 4,432 | 4,565 | 4,679 | 4,812 | 4,926 |
| Nasdaq (^IXIC): Daily | 14,395 | 14,459 | 14,542 | 14,607 | 14,690 |
| Weekly | 14,220 | 14,372 | 14,630 | 14,782 | 15,040 |
| Monthly | 13,486 | 14,005 | 14,578 | 15,097 | 15,669 |
Here are the formulas:
![]()
Earnings season will be starting in about 8 days.
Here's a symbol list of 114 chart and candlestick patterns (13 "investment grade" candle patterns) found in today's securities using my version of Patternz: DDD, AXDX, AMD, ALK, AEO, ANIK, APA, AAPL, ADM, ANET, ADP, BALL, BSET, BA, BAH, BFH, CX, CHD, CIEN, CTAS, CLNE, CLF, CTSH, ED, CONN, CSGS, DFS, D, DRQ, EXP, EOG, EXC, FE, GES, HSII, HSIC, HOLX, HWM, NVTA, JAZZ, KLAC, LHX, LDOS, LNC, RAMP, LMT, MTSI, MGY, MCHX, MTRX, MGEE, MSFT, MLKN, MOS, MUR, MYGN, NKE, NI, NOC, OXY, PRFT, PETS, PPL, PG, RTX, ROK, ROST, R, SBH, SAND, SAIC, SRE, SHOP, SXI, SUM, SRDX, SNPS, TPR, TFX, TEVA, TRV, TZOO, UGI, UNH, VLO, VECO, VC, ZBRA, IHE, FXI, MXI, SLV, EWM, EPP, PBE, PEJ, PXJ. Click this link for details (pattern type, start and end dates).
For a list of small patterns (those a few days wide) click this link.
The below industries were the best (rank 1) or worst performing of those I follow.
|
-- Thomas Bulkowski
![]()
$ $ $
Here's a symbol list of 156 chart and candlestick patterns (13 "investment grade" candle patterns) found in today's securities using my version of Patternz: DDD, ACN, AEIS, ALK, ALL, AMZN, AXP, AFG, ANIK, AAPL, AMAT, ADM, ADP, AVNT, BSET, BECN, BZH, BIIB, BOOT, BFH, BCO, CBT, CE, CF, CHS, CIEN, CLNE, CLF, CNO, CNX, CGNX, CMTL, ED, COP, CXW, GLW, CSGS, XRAY, DVN, FANG, DFS, D, DOV, DRQ, EXP, ELV, EOG, EPAM, EFX, GNW, GPRO, HL, HSII, HP, HNI, HOLX, JBHT, HUN, HURC, IDXX, ITW, PODD, ITGR, IBKR, INTU, NVTA, JNJ, KALU, KELYA, KMT, KEYS, LHX, LLY, RAMP, LMT, LOW, MTSI, M, MGY, MRO, MTDR, MTRX, MGEE, MSFT, MOS, MUR, MYGN, NBR, NKE, NOC, NWPX, OXY, OMCL, OTEX, PTEN, PEN, PCG, PXD, PLXS, RRC, RTX, RHI, ROK, RES, R, SBH, SAND, SLB, SMTC, SKX, SWN, SRDX, TFX, TXN, TMO, UHAL, VFC, VLO, VECO, VRSN, WU, WWW, ZBRA, IYC, IYE, ITB, IEZ, IHE, BOTZ, IGV, MXI, IEO, EWK, EWH, EWM, EPP, TUR, PXJ, PHO, XLY, XLE, XLI, XAR, UNG, VIS, VAW. Click this link for details (pattern type, start and end dates).
For a list of small patterns (those a few days wide) click this link.
$ $ $
You can find setups based on a Fibonacci retrace by clicking on the link.
The following patterns were found manually, not using Patternz. Mr. Bulkowski has excluded any securities he owns from appearing in the list. However, he may add any of the securities listed to his portfolio at any time, just as you can.
In the table below, the red and green colors are based on the historical breakout direction for the associated chart pattern. If a high and tight flag appears, the start and end dates highlight the flagpole only and not the flag.
For details about the chart patterns, click here.
-- Thomas Bulkowski
![]()
| Symbol | Chart Pattern | Bullish Bearish | Start | End | Industry |
| DDD | Big M | 12/14/2023 | 12/26/2023 | Electronics | |
| ADBE | Double Top, Eve and Adam | 11/29/2023 | 12/12/2023 | Computer Software and Svcs | |
| ALK | Pipe top | 12/18/2023 | 12/26/2023 | Air Transport | |
| APH | Double Top, Adam and Eve | 12/15/2023 | 12/26/2023 | Electronics | |
| AMAT | Double Top, Eve and Eve | 12/15/2023 | 12/28/2023 | Semiconductor Cap Equip. | |
| ANET | Double Top, Eve and Eve | 12/18/2023 | 12/26/2023 | E-Commerce | |
| BAX | Broadening top | 12/14/2023 | 01/03/2024 | Medical Supplies | |
| BIO | Pipe bottom | 10/23/2023 | 10/30/2023 | Medical Supplies | |
| BOOT | Head-and-shoulders top | 12/04/2023 | 12/27/2023 | Shoe | |
| BBW | Falling wedge | 11/30/2023 | 01/04/2024 | Retail (Special Lines) | |
| BLDR | Double Top, Adam and Eve | 12/14/2023 | 12/28/2023 | Retail Building Supply | |
| BG | Double Top, Adam and Adam | 11/24/2023 | 12/01/2023 | Food Processing | |
| CDNS | Triple top | 11/30/2023 | 12/26/2023 | Computer Software and Svcs | |
| CHD | Double Bottom, Adam and Adam | 12/15/2023 | 12/21/2023 | Household Products | |
| CLF | Pipe top | 12/18/2023 | 12/26/2023 | Metals and Mining (Div.) | |
| CR | Double Bottom, Eve and Adam | 11/29/2023 | 12/07/2023 | Diversified Co. | |
| EXP | Double Top, Eve and Eve | 12/20/2023 | 12/26/2023 | Cement and Aggregates | |
| EPAM | Double Top, Eve and Eve | 12/19/2023 | 12/28/2023 | IT Services | |
| EFX | Double Top, Eve and Eve | 12/18/2023 | 12/28/2023 | Information Services | |
| FFIV | Double Top, Adam and Eve | 12/19/2023 | 12/26/2023 | Internet | |
| FIS | Diamond top | 12/27/2023 | 01/04/2024 | Computer Software and Svcs | |
| FLEX | Dead-cat bounce | 01/03/2024 | 01/03/2024 | Electronics | |
| FTV | Double Top, Adam and Eve | 12/14/2023 | 12/27/2023 | Industrial Services | |
| HL | Head-and-shoulders top | 12/01/2023 | 12/22/2023 | Metals and Mining (Div.) | |
| IBKR | Ugly double bottom | 11/29/2023 | 12/15/2023 | Securities Brokerage | |
| JAZZ | Ugly double bottom | 11/28/2023 | 12/22/2023 | Biotechnology | |
| KLAC | Double Top, Eve and Eve | 12/18/2023 | 12/28/2023 | Semiconductor Cap Equip. | |
| KSS | Double Top, Adam and Eve | 12/14/2023 | 12/28/2023 | Retail Store | |
| KLIC | Double Top, Adam and Eve | 12/15/2023 | 12/26/2023 | Semiconductor Cap Equip. | |
| LXU | Double Top, Adam and Eve | 12/14/2023 | 12/26/2023 | Building Materials | |
| MLKN | Pipe top | 12/11/2023 | 12/18/2023 | Furn/Home Furnishings | |
| NOVT | Double Top, Adam and Eve | 12/19/2023 | 12/27/2023 | Precision Instrument | |
| OMCL | Double Top, Adam and Eve | 12/15/2023 | 12/22/2023 | Healthcare Information | |
| ON | Double Top, Adam and Eve | 12/15/2023 | 12/27/2023 | Semiconductor | |
| PCTY | Double Top, Eve and Adam | 12/14/2023 | 12/28/2023 | E-Commerce | |
| PYPL | Triangle, symmetrical | 12/14/2023 | 12/28/2023 | Financial Services | |
| PFE | Pipe bottom | 12/11/2023 | 12/18/2023 | Drug | |
| PPG | Double Top, Adam and Eve | 12/14/2023 | 12/28/2023 | Chemical (Diversified) | |
| PG | Double Bottom, Adam and Adam | 12/15/2023 | 12/21/2023 | Household Products | |
| RMBS | Double Top, Adam and Eve | 12/14/2023 | 12/26/2023 | Semiconductor Cap Equip. | |
| RHI | Double Top, Eve and Eve | 12/20/2023 | 12/29/2023 | Human Resources | |
| RCKY | Double Top, Eve and Adam | 12/11/2023 | 12/26/2023 | Shoe | |
| SHOP | Double Top, Eve and Eve | 12/19/2023 | 12/29/2023 | E-Commerce | |
| SWX | Triangle, symmetrical | 12/14/2023 | 01/04/2024 | Natural Gas (Distributor) | |
| TPX | Double Top, Adam and Eve | 12/15/2023 | 12/29/2023 | Furn/Home Furnishings | |
| TXN | Double Top, Adam and Eve | 12/15/2023 | 12/28/2023 | Semiconductor | |
| TZOO | Big M | 12/04/2023 | 12/14/2023 | Internet | |
| TWLO | Double Top, Adam and Eve | 12/19/2023 | 12/28/2023 | E-Commerce | |
| VRSN | Double Top, Adam and Adam | 12/04/2023 | 12/14/2023 | Internet | |
| VMC | Double Top, Adam and Eve | 12/15/2023 | 12/29/2023 | Cement and Aggregates | |
| WSO | Double Top, Adam and Eve | 12/19/2023 | 12/29/2023 | Retail Building Supply | |
| WWW | Head-and-shoulders top | 12/04/2023 | 12/26/2023 | Shoe | |
| ZBRA | Double Top, Adam and Eve | 12/15/2023 | 12/27/2023 | Computers and Peripherals |
![]()
Since I post this the night before, check how the futures are trading before market open. Large moves can affect the opening direction.
$ $ $
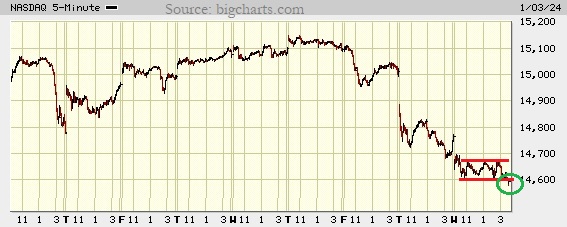
I show a picture of the Nasdaq composite on the 5-minute scale.
Let me address the big picture first. The CPI has turned bearish, reading 8.8, which is close to the lowest it can go (0). I believe the retrace that I've been looking for has begun. That means a drop to about 14,300, matching the horizontal move in the index in late November.
As to the chart, the green circle highlights weakness in the index. It has closed below the red rectangle bottom. That suggests, but does not guarantee, that the index is headed lower.
$ $ $
Here's a symbol list of 261 chart and candlestick patterns (13 "investment grade" candle patterns) found in today's securities using my version of Patternz: DDD, ABT, ACN, ADBE, ADTN, AEIS, AMD, A, AKAM, ALK, AA, AMN, APH, AMAT, ACGL, ANET, ARW, ADSK, ADP, AVNT, AXS, BMI, BCPC, BZH, BERY, BIO, BMRN, BA, BCO, BRKR, CBT, CDNS, CALM, CE, CX, COR, CENX, CDAY, CRL, CHD, CLNE, CLF, CLX, CGNX, ED, CSGP, COTY, CRH, CCK, CSGS, CW, DFS, DSGR, ^DJT, ^DJI, DOV, EXP, ELV, EME, EPAM, EFX, FDS, FDX, FE, FIVN, FLEX, FORM, FTV, FWRD, FCX, IT, GD, GE, GIS, GMS, GPRO, GGG, GFF, HL, HSIC, HOLX, HD, HON, JBHT, HUN, NSP, IIIN, PODD, INTC, IPAR, IPG, INTU, ISRG, NVTA, IRM, JAZZ, JBLU, KALU, KELYA, KMT, KEYS, KSS, KLIC, LHX, LH, LANC, LLY, RAMP, MHO, MTSI, M, MANH, MAN, MLM, MRK, MLKN, MCO, MOS, MLI, MUR, MYGN, ^IXIC, NWL, NEU, NKE, NWPX, NOVT, NTNX, ORI, OMCL, ON, OTEX, ORCL, OR, OMI, PKG, PKE, PATK, PDCO, PCTY, PEN, PETS, PPG, PGR, PEG, PSTG, QTWO, QCOM, RMBS, RRC, RNG, ROK, ROST, RGLD, R, CRM, SBH, SAND, SEIC, SMTC, NOW, SHOP, SKX, SMAR, LUV, SWX, SWN, SPSC, SXI, SUM, SRDX, SNPS, TFX, TPX, TER, TKR, TOL, TSCO, TREX, TWLO, UHAL, SLCA, UNH, VECO, VEEV, VC, WRB, WSO, WPM, WOLF, WWW, ZBRA, IYM, IAI, IYC, ITB, IHE, FTEC, FDN, QTEC, FXL, BOTZ, QQQ, ICF, IHF, IAT, IEV, IGV, MXI, IXN, SOXX, SLV, EWA, EWO, EWK, EEM, EWQ, EWG, EWH, EWI, EWJ, EPP, EWS, EZA, EWY, EWD, EWT, QLD, PBE, PEJ, PHO, ROBO, XLY, XHB, XAR, XLK, UNG, USO, SMH, VAW, MGK, VONG. Click this link for details (pattern type, start and end dates).
For a list of small patterns (those a few days wide) click this link.
$ $ $
The following table shows where Fibonacci retrace values of the day's high-low range are plus pivot points, calculated on the Nasdaq composite, sorted by value. When several are near each other (small differences), the area might act as support or resistance.
-- Thomas Bulkowski
![]()
| © 2024 ThePatternSite.com Metric | Value | Diff | Close (within 10% of the high-low range for the day)? |
| Monthly S2 | 13,508.72 | ||
| Monthly S1 | 14,050.46 | 541.75 | |
| Daily S2 | 14,504.27 | 453.81 | |
| Daily S1 | 14,548.24 | 43.97 | |
| Low | 14,577.44 | 29.20 | |
| Close | 14,592.21 | 14.77 | |
| Monthly Pivot | 14,600.27 | 8.06 | Yes! The Monthly Pivot is close to the Close. |
| Daily Pivot | 14,621.41 | 21.14 | |
| 61.8% Down from Intraday High | 14,622.19 | 0.78 | Yes! The 61.8% Down from Intraday High is close to the Daily Pivot. |
| 50% Down from Intraday High | 14,636.01 | 13.82 | |
| Open | 14,641.47 | 5.46 | Yes! The Open is close to the 50% Down from Intraday High. |
| Weekly S1 | 14,648.36 | 6.89 | Yes! The Weekly S1 is close to the Open. |
| 38.2% Down from Intraday High | 14,649.83 | 1.47 | Yes! The 38.2% Down from Intraday High is close to the Weekly S1. |
| Daily R1 | 14,665.38 | 15.55 | |
| High | 14,694.58 | 29.20 | |
| Weekly S2 | 14,704.52 | 9.94 | Yes! The Weekly S2 is close to the High. |
| Daily R2 | 14,738.55 | 34.03 | |
| Weekly R1 | 14,843.06 | 104.51 | |
| Weekly Pivot | 14,899.22 | 56.15 | |
| Weekly R2 | 15,093.92 | 194.70 | |
| Monthly R1 | 15,142.01 | 48.10 | |
| Monthly R2 | 15,691.82 | 549.80 |
Here's the updated 2024 market forecast, presented in slider format.
$ $ $
Here's a symbol list of 172 chart and candlestick patterns (13 "investment grade" candle patterns) found in today's securities using my version of Patternz: MMM, ADBE, ADTN, AEIS, AFL, AKAM, ALKS, AXP, AIG, AMWD, AON, AAPL, ATR, ADSK, ADP, BCPC, BAX, BIG, BIO, BIIB, BKH, BRC, BBW, CDNS, CNC, CDAY, CHD, CLF, CLX, CNX, ED, COP, GLW, CSGS, CMI, DHR, DVN, DSGR, D, EXP, EIX, ELV, EME, EFX, EQT, EG, EXPI, FARO, FIS, FIVN, FORM, GIS, GILD, GMS, THG, HL, HOLX, HOV, INCY, IBP, IIIN, ITGR, INTC, IPAR, NVTA, JAZZ, KEYS, LHX, LRCX, LNC, LMT, MTSI, MANH, MTRX, MDC, MDT, MGEE, MU, MLKN, MS, MLI, MYGN, NTAP, NJR, NWL, NOVT, OGE, ORI, OTEX, ORCL, OMI, PATK, PDCO, PETS, PCG, PNW, PRU, PHM, QCOM, DGX, RL, RMBS, RTX, ROK, CRM, SBH, SEE, SEIC, SIGI, SCI, SHOP, SPSC, SRDX, SNPS, TRGP, TFX, TER, TEVA, TXT, TMO, TOL, TSCO, VMI, VECO, VRTX, WU, WMB, WSM, WSC, ZBRA, IAI, IYC, ITB, IDU, FDN, QTEC, FXL, ICF, IYH, IHF, IAT, IYZ, IEV, MXI, EWA, EWK, EWC, EWQ, EWI, EPP, EWD, EWT, EWU, IBB, DBA, PEJ, PJP, XLF, GLD, XHB, SMH, VHT. Click this link for details (pattern type, start and end dates).
For a list of small patterns (those a few days wide) click this link.
-- Thomas Bulkowski
![]()
$ $ $
I show another slider trading quiz featuring Diamond top.
$ $ $
Here's a symbol list of 111 chart and candlestick patterns (13 "investment grade" candle patterns) found in today's securities using my version of Patternz: A, ALRM, BCPC, BSET, BIIB, BMRN, BSX, BLDR, CAL, CPB, CNC, CNP, CHS, CLX, CNA, CL, CMTL, ED, CAG, CONN, CRH, CCRN, CSGS, DUK, EXP, EFX, EQT, EXC, EZPW, FIVN, FMC, FTV, HOV, HUM, JBHT, PODD, ITGR, INTC, IPAR, IPG, NVTA, LHX, LH, LPLA, MRO, MTRX, MLKN, MOS, MYGN, NFG, NFLX, NTAP, NWPX, OMC, OTEX, ORCL, OMI, OXM, PKG, PATK, PFE, PXD, PFG, DGX, RMBS, RLI, ROK, SBH, SCHW, SRE, NOW, SHOP, SLGN, STR, SKX, SPLK, SRDX, SNPS, TFX, UIS, UPS, VMC, WSC, XEL, ZBRA, IAI, IEZ, ICF, IGV, MXI, EWQ, EWJ, EWM, EPP, EWS, EZA, IBB, PBE, PXJ, ROBO, XLY, UNG. Click this link for details (pattern type, start and end dates).
For a list of small patterns (those a few days wide) click this link.
$ $ $
The following table shows where Fibonacci retrace values of the day's high-low range are plus pivot points, calculated on the Dow industrials, sorted by value. When several are near each other (small differences), the area might act as support or resistance.
-- Thomas Bulkowski
![]()
| © 2023 ThePatternSite.com Metric | Value | Diff | Close (within 10% of the high-low range for the day)? |
| Monthly S2 | 34,418.04 | ||
| Monthly S1 | 36,053.79 | 1,635.75 | |
| Monthly Pivot | 36,916.32 | 862.53 | |
| Weekly S2 | 37,206.39 | 290.07 | |
| Daily S2 | 37,441.96 | 235.57 | |
| Weekly S1 | 37,447.96 | 6.00 | Yes! The Weekly S1 is close to the Daily S2. |
| Low | 37,538.80 | 90.84 | |
| Daily S1 | 37,565.75 | 26.95 | |
| Weekly Pivot | 37,613.41 | 47.66 | |
| 61.8% Down from Intraday High | 37,623.08 | 9.68 | Yes! The 61.8% Down from Intraday High is close to the Weekly Pivot. |
| 50% Down from Intraday High | 37,649.11 | 26.03 | |
| Daily Pivot | 37,662.59 | 13.48 | Yes! The Daily Pivot is close to the 50% Down from Intraday High. |
| 38.2% Down from Intraday High | 37,675.15 | 12.56 | Yes! The 38.2% Down from Intraday High is close to the Daily Pivot. |
| Close | 37,689.54 | 14.39 | Yes! The Close is close to the 38.2% Down from Intraday High. |
| Open | 37,701.63 | 12.09 | Yes! The Open is close to the Close. |
| High | 37,759.43 | 57.80 | |
| Daily R1 | 37,786.38 | 26.95 | |
| Weekly R1 | 37,854.98 | 68.61 | |
| Daily R2 | 37,883.22 | 28.23 | |
| Weekly R2 | 38,020.43 | 137.21 | |
| Monthly R1 | 38,552.07 | 531.64 | |
| Monthly R2 | 39,414.60 | 862.53 |
Support this site! Clicking any of the books (below) takes you to
Amazon.com If you buy ANYTHING while there, they pay for the referral.
Legal notice for paid links: "As an Amazon Associate I earn from qualifying purchases."
|
My Stock Market Books
|
My Novels
Orb Foresight Rewrite Coming!
|