
As of 03/31/2026
Indus: 46,342 +1,125.37 +2.5%
Trans: 18,610 +579.97 +3.2%
Utils: 1,159 +0.80 +0.1%
Nasdaq: 21,591 +795.99 +3.8%
S&P 500: 6,529 +184.80 +2.9%
|
YTD
-3.6%
+7.2%
+8.5%
-7.1%
-4.6%
|
|
As of 03/31/2026
Indus: 46,342 +1,125.37 +2.5%
Trans: 18,610 +579.97 +3.2%
Utils: 1,159 +0.80 +0.1%
Nasdaq: 21,591 +795.99 +3.8%
S&P 500: 6,529 +184.80 +2.9%
|
YTD
-3.6%
+7.2%
+8.5%
-7.1%
-4.6%
| |
|
| ||
Since I post this the night before, check how the futures are trading before market open. Large moves can affect the opening direction.
$ $ $
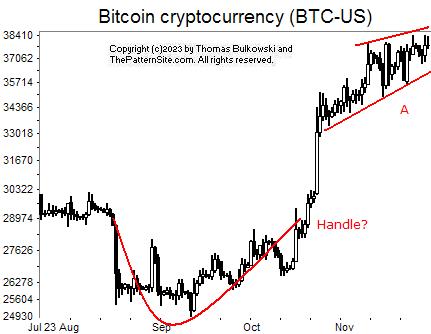
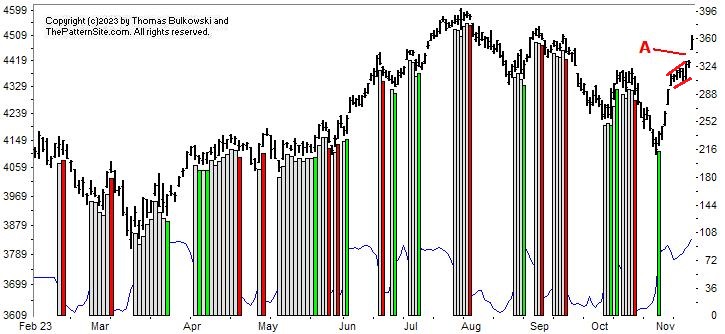
I show a picture of bitcoin (BTC-USD) on the daily chart.
A cup with handle appears as a rounded turn in red on the chart. Yes, it's not a smooth turn and the handle is wimpy. But the move after completion shows a good rise.
Now we have a bearish chart pattern (where the cup was bullish). It's called a rising wedge. I show that at A. Rising wedges breakout downward 60% of the time, so that's the way to bet.
$ $ $
Here's a symbol list of 198 chart and candlestick patterns (13 "investment grade" candle patterns) found in today's securities using my version of Patternz: AXDX, ACIW, AMD, AKAM, ALRM, ALGT, AYX, AMZN, AEE, AEO, AXP, APH, ANIK, AR, AAPL, ACGL, AVNT, AXS, BCPC, BALL, BSET, BKNG, BAH, CDNS, CAL, CE, CLS, CNC, CNP, CVX, CTAS, CNA, CTSH, ED, CXW, COST, CR, CROX, CCK, CSGS, CTS, CMI, DFS, ^DJU, DTE, DUK, EBAY, EIX, ELV, EOG, EPAM, EFX, EG, EVRG, EXC, EXPI, FFIV, FARO, FIVN, GME, GPN, GL, GOOGL, GES, HLIT, HAYN, HP, HD, HON, HWM, HURC, IBP, INTC, INTU, IRM, JBLU, KELYA, KFRC, KSS, KLIC, LAMR, LDOS, LNC, LMT, L, MTSI, M, MGY, MANH, MCHX, MKTX, MAS, MTRN, META, MGEE, MS, MYGN, NFLX, NTGR, NTAP, NKE, NI, JWN, NWPX, NTNX, OXY, OGE, OTEX, PATK, PDCO, PCTY, PRFT, PXD, PLXS, PPG, PFG, PG, PRU, QCOM, RRC, RGA, ROL, ROST, CRM, SBH, SAND, SAIC, SMG, SRE, SCI, SLGN, SKX, SMAR, SO, LUV, SWX, SWN, SNPS, TPR, TGT, TDOC, TFX, TMO, TJX, TSCO, TDG, TREX, UGI, VRSN, WMT, WU, WOLF, WDAY, XEL, ZBRA, IYK, FDN, QTEC, FXL, FXI, BOTZ, ICF, IAT, IYZ, IGV, IXC, SOXX, EWG, EWH, EIS, EWI, EWS, EWP, EWD, EWT, PPA, ROBO, XLP, XLU, SMH. Click this link for details (pattern type, start and end dates).
For a list of small patterns (those a few days wide) click this link.
$ $ $
The following table shows where Fibonacci retrace values of the day's high-low range are plus pivot points, calculated on the Nasdaq composite, sorted by value. When several are near each other (small differences), the area might act as support or resistance.
-- Thomas Bulkowski
![]()
| © 2023 ThePatternSite.com Metric | Value | Diff | Close (within 10% of the high-low range for the day)? |
| Monthly S2 | 11,904.90 | ||
| Monthly S1 | 13,081.70 | 1,176.79 | |
| Monthly Pivot | 13,720.65 | 638.96 | |
| Weekly S2 | 14,025.36 | 304.70 | |
| Daily S2 | 14,134.54 | 109.18 | |
| Weekly S1 | 14,141.92 | 7.39 | Yes! The Weekly S1 is close to the Daily S2. |
| Daily S1 | 14,196.51 | 54.59 | |
| Low | 14,247.89 | 51.38 | |
| Weekly Pivot | 14,250.77 | 2.88 | Yes! The Weekly Pivot is close to the Low. |
| Close | 14,258.49 | 7.72 | Yes! The Close is close to the Weekly Pivot. |
| Daily Pivot | 14,309.87 | 51.38 | |
| 61.8% Down from Intraday High | 14,314.87 | 5.00 | Yes! The 61.8% Down from Intraday High is close to the Daily Pivot. |
| 50% Down from Intraday High | 14,335.55 | 20.69 | |
| 38.2% Down from Intraday High | 14,356.24 | 20.69 | |
| Open | 14,367.11 | 10.87 | Yes! The Open is close to the 38.2% Down from Intraday High. |
| Weekly R1 | 14,367.33 | 0.22 | Yes! The Weekly R1 is close to the Open. |
| Daily R1 | 14,371.84 | 4.51 | Yes! The Daily R1 is close to the Weekly R1. |
| High | 14,423.22 | 51.38 | |
| Weekly R2 | 14,476.18 | 52.96 | |
| Daily R2 | 14,485.20 | 9.02 | Yes! The Daily R2 is close to the Weekly R2. |
| Monthly R1 | 14,897.45 | 412.25 | |
| Monthly R2 | 15,536.40 | 638.96 |
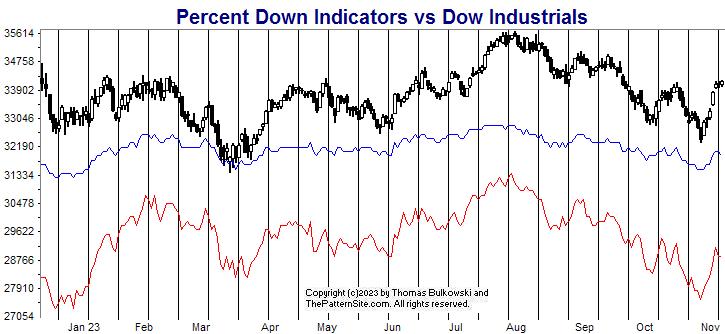
This is a picture of the chart pattern indicator on the daily scale. The indicator is the line chart below a chart of the S&P 500 composite.
The chart shows the CPI in the neutral zone, but it's a hair above bearish. I believe it means the index is going down.
The index is at overhead resistance setup by the prior July/August peak. You can see how the index has moved horizontally over the past week or so (perhaps because of the holiday).
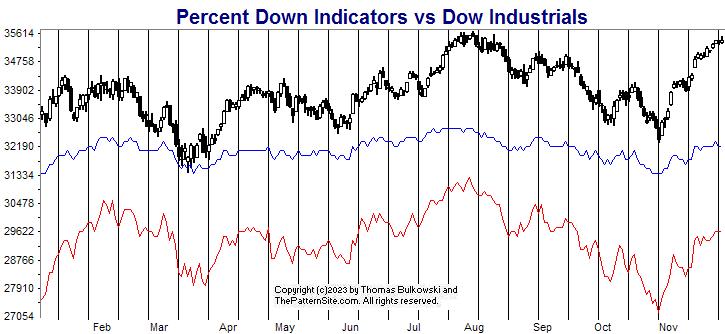
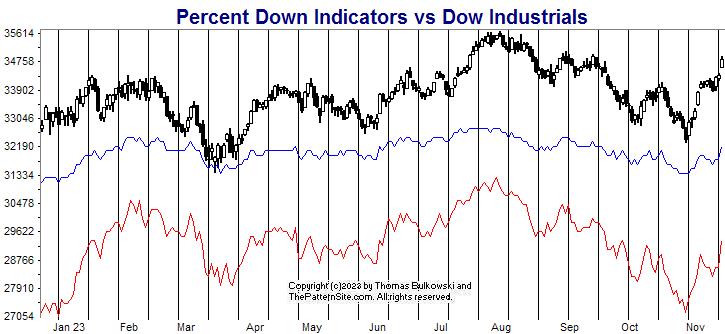
The red line is the percentage of stocks at least 20% below their 1-year high (plotted upside down). The blue line is the average percentage drop of stocks below their 1-year high (plotted upside down).
On Tuesday, 38% of stocks in my database are in bear market territory (down at least 20% from their 1-year high).A week ago, it was 40%.The fewest was 26% on 07/31/2023.And the most was 57% on 12/19/2022.
The 518 stocks in my database are down an average of 19% from their yearly high.A week ago, the average was 18%.The peak was 14% on 07/31/2023.And the bottom was 27% on 12/19/2022.
The red line shows improvement from a week ago and the blue line is worse. Go figure.
Because the two lines follow the index, I don't have much faith in what they say.
The CPI chart is neutral but hinting of a downturn and this chart is mixed. I still think the index is going lower.
$ $ $
Here's a symbol list of 136 chart and candlestick patterns (13 "investment grade" candle patterns) found in today's securities using my version of Patternz: AXDX, APD, AKAM, ALRM, DOX, AEO, AEP, AIG, AME, AMN, ADSK, AXS, BALL, BECN, BIG, BKH, BR, CBT, CACI, CE, CNC, CDAY, CLNE, CNA, CTSH, CMCO, CR, CRH, CCK, DFS, EG, EZPW, FE, FISV, FLEX, FRD, GE, GL, GS, GGG, GFF, HAYN, HSII, HP, HON, HWM, IIIN, INTU, JAZZ, KELYA, KMB, KLIC, LH, LDOS, L, LPLA, MHO, MAN, MLM, MTRN, META, MU, MOS, MYGN, NOV, NEU, NWPX, OR, OXM, PATK, PFE, PCG, PLXS, PPL, PFG, PG, PRU, PEG, QCOM, RL, RRC, RJF, RGA, RLI, ROST, SAND, SLB, SAIC, SRE, SMTC, SKX, SKYW, SO, SXI, SUM, TRGP, TDOC, TFX, TDG, TZOO, TG, UNH, MDRX, V, VMC, WU, WMB, WDAY, XEL, IYM, IYK, IHE, FXI, EWO, EWH, EIS, EWP, THD, TUR, EWU, SSO, XLP, GLD, XRT, SPY. Click this link for details (pattern type, start and end dates).
For a list of small patterns (those a few days wide) click this link.
-- Thomas Bulkowski
![]()
$ $ $
I show another slider trading quiz featuring V-tops.
$ $ $
I released version 8.0.0.3 to fix a quote download problem with Stockdata.org files. If you use this service, use historical quotes (once) to replace your existing files with new ones.
$ $ $
Here's a symbol list of 85 chart and candlestick patterns (13 "investment grade" candle patterns) found in today's securities using my version of Patternz: ALGT, DOX, AMED, AMN, APH, ANIK, AON, ACGL, BSET, BIG, BR, CNC, CHS, CLNE, ED, FANG, DDS, EXPI, EZPW, FICO, FE, FMC, FRD, GNW, GS, HE, HL, HWM, HURC, IPI, NVTA, IRM, KMT, LHX, LLY, LMT, M, MTRN, MLI, NI, JWN, NOVT, OR, OUT, OMI, OXM, PKG, PFE, PCG, PPG, PEG, QCOM, RMBS, RGLD, SAND, SRE, SCCO, TFX, TEVA, TXT, TZOO, TG, UHAL, UNH, VMI, VEEV, MDRX, V, VMC, WU, FXI, SLV, EWH, EWI, EWM, TUR, DBA, PJP, GLD. Click this link for details (pattern type, start and end dates).
For a list of small patterns (those a few days wide) click this link.
$ $ $
The following table shows where Fibonacci retrace values of the day's high-low range are plus pivot points, calculated on the Dow industrials, sorted by value. When several are near each other (small differences), the area might act as support or resistance.
-- Thomas Bulkowski
![]()
| © 2023 ThePatternSite.com Metric | Value | Diff | Close (within 10% of the high-low range for the day)? |
| Monthly S2 | 31,281.13 | ||
| Monthly S1 | 33,307.30 | 2,026.17 | |
| Monthly Pivot | 34,353.37 | 1,046.07 | |
| Weekly S2 | 34,722.17 | 368.80 | |
| Weekly S1 | 35,027.82 | 305.65 | |
| Daily S2 | 35,211.67 | 183.85 | |
| Weekly Pivot | 35,213.63 | 1.96 | Yes! The Weekly Pivot is close to the Daily S2. |
| Daily S1 | 35,272.57 | 58.94 | |
| Low | 35,280.57 | 8.00 | Yes! The Low is close to the Daily S1. |
| 61.8% Down from Intraday High | 35,330.15 | 49.58 | |
| Close | 35,333.47 | 3.32 | Yes! The Close is close to the 61.8% Down from Intraday High. |
| Daily Pivot | 35,341.47 | 8.00 | Yes! The Daily Pivot is close to the Close. |
| 50% Down from Intraday High | 35,345.47 | 4.00 | Yes! The 50% Down from Intraday High is close to the Daily Pivot. |
| 38.2% Down from Intraday High | 35,360.79 | 15.32 | |
| Open | 35,376.44 | 15.66 | |
| Daily R1 | 35,402.37 | 25.93 | |
| High | 35,410.37 | 8.00 | Yes! The High is close to the Daily R1. |
| Daily R2 | 35,471.27 | 60.90 | |
| Weekly R1 | 35,519.28 | 48.01 | |
| Weekly R2 | 35,705.09 | 185.81 | |
| Monthly R1 | 36,379.54 | 674.45 | |
| Monthly R2 | 37,425.61 | 1,046.07 |
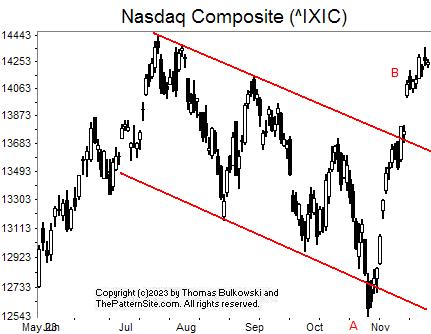
I show the Nasdaq composite on the daily scale.
There's not much to talk about on the chart.
I drew trendlines along the peaks and mirrored a parallel trendline along the valleys. It shows the index pushing lower through the bottom trendline (A). In a measure-rule type move up, the index soared through the top trendline (B) and kept going.
The measure rule for trendlines, incidentally, suggests the move below the trendline will occur above the trendline in equal measure. It rarely works, but it's the thought that counts.
![]()
I still think the index will drop. That could happen in December, the first half of which is supposed to be weak. But if the FED raises interest rates (Dec 13), then look out below because the markets will tumble.
If they do, I'm all in (buying).
![]()
The following is a brief review of how the markets performed over time. The numbers refer to the close-to-close move in the Dow industrials.
No options expire this week.
![]()
The following is based on an SFO article in December 2004 by John Seekinger, titled, "Take a two-dimensional approach." He offers these tips.
| Index | S2 | S1 | Pivot | R1 | R2 |
| Dow Industrials (^DJI): Daily | 35,264 | 35,327 | 35,363 | 35,426 | 35,463 |
| Weekly | 34,741 | 35,066 | 35,233 | 35,557 | 35,724 |
| Monthly | 31,300 | 33,345 | 34,372 | 36,417 | 37,445 |
| S&P500 (^GSPC): Daily | 4,550 | 4,555 | 4,557 | 4,562 | 4,565 |
| Weekly | 4,488 | 4,524 | 4,546 | 4,582 | 4,604 |
| Monthly | 3,946 | 4,253 | 4,411 | 4,717 | 4,875 |
| Nasdaq (^IXIC): Daily | 14,189 | 14,220 | 14,245 | 14,276 | 14,301 |
| Weekly | 14,023 | 14,137 | 14,248 | 14,362 | 14,474 |
| Monthly | 11,902 | 13,077 | 13,718 | 14,892 | 15,534 |
Here are the formulas:
![]()
Earnings season is either underway or should be starting soon. The sessions could be more volatile.
Mutual funds will begin dividend distributions and rebalancing their portfolios for the approaching year end (starts in late November).
Here's a symbol list of 122 chart and candlestick patterns (13 "investment grade" candle patterns) found in today's securities using my version of Patternz: DDD, ABM, AXDX, ALGT, DOX, AMED, AEO, AFG, AMN, AR, ACGL, AXS, AZTA, BALL, BAX, BERY, BIG, BLDR, CLNE, CLX, CNA, CMCO, CAG, CSGP, CMI, DHR, DDS, DOV, BOOM, ELV, WIRE, EG, EXPI, EZPW, FIS, FNV, GNW, GPRO, GGG, GFF, HE, HAYN, HTLD, HL, HELE, HON, INFN, IPI, NVTA, KMT, KLIC, LHX, LNC, LMT, LOW, LPLA, M, MRTN, MTRN, MDT, NEU, NI, JWN, NOVT, ORI, ASGN, OR, PANW, PGR, PRU, KWR, QCOM, RRC, RTX, RNG, RLI, RHI, RES, SAIA, SAND, STR, SWN, SUM, SNPS, TFX, TEVA, TRV, TREX, TWLO, SLCA, VEEV, VRSN, V, WSO, WERN, WU, WMB, IHE, FXL, SLV, IEO, EWA, EWK, EWC, EWH, EIS, EWY, EWP, EWD, EWL, THD, IBB, DBA, PBE, PJP, XHB. Click this link for details (pattern type, start and end dates).
For a list of small patterns (those a few days wide) click this link.
The below industries were the best (rank 1) or worst performing of those I follow.
|
-- Thomas Bulkowski
![]()
$ $ $
Here's a symbol list of 19 chart and candlestick patterns (13 "investment grade" candle patterns) found in today's securities using my version of Patternz: ALGT, AMN, BIG, CLNE, DDS, EXPI, GNW, HE, HL, IPI, NVTA, KMT, M, MTDR, MGEE, JWN, NOVT, VEEV, USO. Click this link for details (pattern type, start and end dates).
For a list of small patterns (those a few days wide) click this link.
$ $ $
You can find setups based on a Fibonacci retrace by clicking on the link.
The following patterns were found manually, not using Patternz. Mr. Bulkowski has excluded any securities he owns from appearing in the list. However, he may add any of the securities listed to his portfolio at any time, just as you can.
In the table below, the red and green colors are based on the historical breakout direction for the associated chart pattern. If a high and tight flag appears, the start and end dates highlight the flagpole only and not the flag.
For details about the chart patterns, click here.
-- Thomas Bulkowski
![]()
| Symbol | Chart Pattern | Bullish Bearish | Start | End | Industry |
| DDD | Pipe bottom | 10/23/2023 | 10/30/2023 | Electronics | |
| ASH | Double Bottom, Adam and Adam | 11/02/2023 | 11/10/2023 | Chemical (Basic) | |
| BOOT | Triangle, symmetrical | 11/01/2023 | 11/22/2023 | Shoe | |
| BR | Ugly double bottom | 10/27/2023 | 11/10/2023 | Information Services | |
| CBT | Head-and-shoulders complex bottom | 09/13/2023 | 10/13/2023 | Chemical (Diversified) | |
| CINF | Diamond bottom | 10/02/2023 | 11/22/2023 | Insurance (Prop/Casualty) | |
| DDS | Pipe bottom | 11/06/2023 | 11/13/2023 | Retail Store | |
| ^DJT | Pipe bottom | 10/23/2023 | 10/30/2023 | None | |
| GPS | Flag, high and tight | 10/06/2023 | 11/22/2023 | Apparel | |
| GD | Three Rising Valleys | 10/06/2023 | 11/09/2023 | Aerospace/Defense | |
| GILD | Pipe top | 10/30/2023 | 11/06/2023 | Biotechnology | |
| HL | Big W | 10/05/2023 | 11/10/2023 | Metals and Mining (Div.) | |
| KLAC | Double Bottom, Eve and Eve | 09/26/2023 | 10/26/2023 | Semiconductor Cap Equip. | |
| LLY | Triangle, symmetrical | 11/03/2023 | 11/22/2023 | Drug | |
| M | Pipe bottom | 11/06/2023 | 11/13/2023 | Retail Store | |
| ORI | Rising wedge | 10/17/2023 | 11/22/2023 | Insurance (Prop/Casualty) | |
| STR | Double Top, Adam and Adam | 10/19/2023 | 11/03/2023 | Natural Gas (Diversified) | |
| SCCO | Double Bottom, Eve and Eve | 10/23/2023 | 11/10/2023 | Metals and Mining (Div.) | |
| SR | Head-and-shoulders bottom | 06/21/2023 | 07/17/2023 | Natural Gas (Distributor) | |
| TFX | Ugly double bottom | 10/30/2023 | 11/10/2023 | Diversified Co. | |
| TEVA | Double Bottom, Adam and Adam | 11/10/2023 | 11/16/2023 | Drug | |
| TZOO | Flag, high and tight | 10/23/2023 | 11/22/2023 | Internet | |
| UGI | Triple bottom | 10/06/2023 | 11/10/2023 | Natural Gas (Distributor) | |
| UIS | Flag, high and tight | 11/01/2023 | 11/22/2023 | Computers and Peripherals | |
| UPS | Double Bottom, Adam and Adam | 10/27/2023 | 11/10/2023 | Air Transport | |
| VRSN | Pipe bottom | 10/23/2023 | 10/30/2023 | Internet | |
| WOLF | Pipe bottom | 10/23/2023 | 10/30/2023 | Semiconductor | |
| ZBRA | Double Bottom, Adam and Adam | 10/25/2023 | 11/01/2023 | Computers and Peripherals | |
| ITB | Ugly double bottom | 10/25/2023 | 11/09/2023 | Homebuilding |
![]()
This is a picture of the chart pattern indicator on the daily scale. The indicator is the line chart below a chart of the S&P 500 composite.
The CPI shows that it's still bullish but headed lower. The reading is 66 now, where 65 is neutral, so it's close to changing.
With overhead resistance above, I think it's likely the index will turn lower.
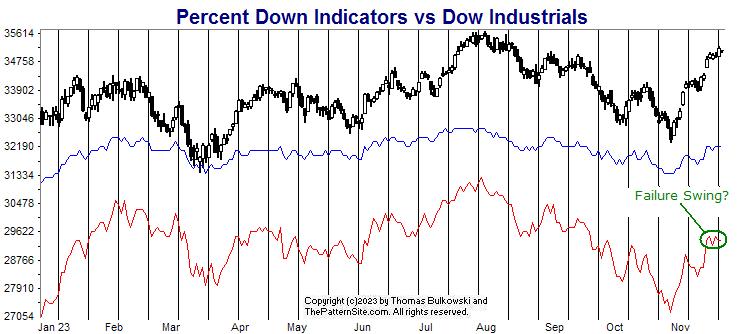
The red line is the percentage of stocks at least 20% below their 1-year high (plotted upside down). The blue line is the average percentage drop of stocks below their 1-year high (plotted upside down).
On Tuesday, 40% of stocks in my database are in bear market territory (down at least 20% from their 1-year high).A week ago, it was 40%.The fewest was 26% on 07/31/2023.And the most was 57% on 12/19/2022.
The 518 stocks in my database are down an average of 19% from their yearly high.A week ago, the average was 19%.The peak was 14% on 07/31/2023.And the bottom was 27% on 12/19/2022.
There's a failure swing, circled in green. I don't know the significance because all this indicator does is follow the index.
I show another one circled in orange, which is supposed to be brown. Regardless, the index and indicator retreated after the appearance.
Both charts hint of weakness. Even through the day before thanksgiving ends higher 57.2% of the time, that's near random. I'm thinking it'll close lower this time.
$ $ $
Here's a symbol list of 113 chart and candlestick patterns (13 "investment grade" candle patterns) found in today's securities using my version of Patternz: ANF, AXDX, A, AKAM, ALGT, AEE, AMN, APOG, ACGL, ASH, ADSK, AVY, BALL, BSET, BIG, BAH, CALM, CAL, CLS, COR, CIEN, CI, CLNE, CNO, CAG, COTY, CRH, CTS, DHR, XRAY, DVN, DDS, EIX, EG, EXC, EXPI, FAST, FDP, GME, IT, GIS, GNW, GILD, HE, HQY, HL, HSY, HWM, JBHT, INCY, IIIN, IPI, NVTA, KMT, LHX, MHO, M, MGY, MKTX, MA, MTDR, MTRN, MDT, MGEE, MLKN, NBR, NOV, JWN, NOVT, OTEX, OR, OMI, PKE, PTEN, PEN, KWR, QCOM, RRC, R, SMTC, SHOP, STR, TFX, TMO, VEEV, WPM, WOLF, IYH, MXI, ILF, IEO, EWK, EWC, EWG, EWM, EWS, EWD, EWL, EWT, THD, DBA, PBE, USO. Click this link for details (pattern type, start and end dates).
For a list of small patterns (those a few days wide) click this link.
-- Thomas Bulkowski
![]()
$ $ $
I show another slider trading quiz featuring Double bottom, Adam & Adam.
$ $ $
Here's a symbol list of 136 chart and candlestick patterns (13 "investment grade" candle patterns) found in today's securities using my version of Patternz: DDD, ABT, AXDX, ACIW, AEIS, AES, AKAM, ALRM, ALGT, AYX, AEO, AEL, AXP, AR, APOG, AWI, ASH, AGO, ADSK, ADP, AVNT, BALL, BAX, BMRN, BA, CACI, CMCO, COTY, CTS, CMI, XRAY, DFS, ^DJI, ELV, EG, FDS, FAST, FE, FORM, GPS, GE, GILD, GOOGL, HAYN, HSII, HON, DHI, HUM, HUN, IDA, IDXX, IIIN, PODD, ITGR, IRM, KELYA, KEYS, KFRC, LEG, LEN, RAMP, L, MHO, MANH, MAN, MCHX, MTRN, MLKN, NFLX, NEU, OGE, OR, PKE, PATK, PETS, PPL, QTWO, QCOM, RRC, REGN, RNG, ROG, SLB, SMG, SHW, STR, SKYW, SUM, TDC, TZOO, VECO, V, WWD, IYK, DDM, FXL, FXI, BOTZ, IYH, ILF, IYF, IHI, ECH, EEM, EWQ, EWH, EIS, EWI, EWP, EWD, EWT, THD, TUR, DBA, PBE, PJP, ROBO, XLF, XLV, XLB, XAR, VHT, VAW, MGK. Click this link for details (pattern type, start and end dates).
For a list of small patterns (those a few days wide) click this link.
$ $ $
The following table shows where Fibonacci retrace values of the day's high-low range are plus pivot points, calculated on the Dow industrials, sorted by value. When several are near each other (small differences), the area might act as support or resistance.
-- Thomas Bulkowski
![]()
| © 2023 ThePatternSite.com Metric | Value | Diff | Close (within 10% of the high-low range for the day)? |
| Monthly S2 | 31,452.55 | ||
| Monthly S1 | 33,301.79 | 1,849.25 | |
| Weekly S2 | 33,957.36 | 655.57 | |
| Monthly Pivot | 34,176.45 | 219.09 | |
| Weekly S1 | 34,554.20 | 377.75 | |
| Daily S2 | 34,776.00 | 221.80 | |
| Weekly Pivot | 34,802.65 | 26.65 | Yes! The Weekly Pivot is close to the Daily S2. |
| Low | 34,907.98 | 105.33 | |
| Open | 34,932.49 | 24.51 | Yes! The Open is close to the Low. |
| Daily S1 | 34,963.52 | 31.03 | Yes! The Daily S1 is close to the Open. |
| 61.8% Down from Intraday High | 35,030.03 | 66.51 | |
| 50% Down from Intraday High | 35,067.73 | 37.70 | |
| Daily Pivot | 35,095.50 | 27.77 | Yes! The Daily Pivot is close to the 50% Down from Intraday High. |
| 38.2% Down from Intraday High | 35,105.43 | 9.93 | Yes! The 38.2% Down from Intraday High is close to the Daily Pivot. |
| Close | 35,151.04 | 45.61 | |
| High | 35,227.48 | 76.44 | |
| Daily R1 | 35,283.02 | 55.54 | |
| Weekly R1 | 35,399.49 | 116.47 | |
| Daily R2 | 35,415.00 | 15.51 | Yes! The Daily R2 is close to the Weekly R1. |
| Weekly R2 | 35,647.94 | 232.94 | |
| Monthly R1 | 36,025.70 | 377.75 | |
| Monthly R2 | 36,900.35 | 874.65 |
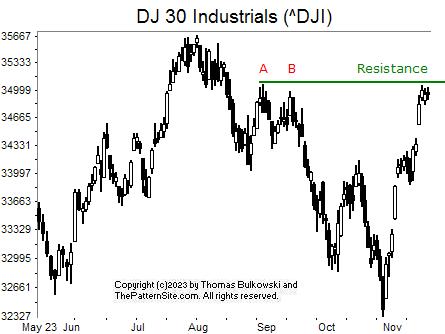
I show the Dow industrials on the daily chart.
AB shows a chart pattern called a double top. That's two peaks near the same price with a valley between them. When the index closes below the valley, it means the pattern is valid and signals the index is going to drop.
And down the index tumbled.
From the October low, the index has recovered to touch the green line. That's overhead resistance setup by peaks A and B. My guess is we'll see the index drop back to, oh, about 34,300, about where the lower end of the gap is.
![]()
The following is a brief review of how the markets performed over time. The numbers refer to the close-to-close move in the Dow industrials.
No options expire this week.
![]()
The following is based on an SFO article in December 2004 by John Seekinger, titled, "Take a two-dimensional approach." He offers these tips.
| Index | S2 | S1 | Pivot | R1 | R2 |
| Dow Industrials (^DJI): Daily | 34,807 | 34,877 | 34,953 | 35,023 | 35,098 |
| Weekly | 33,889 | 34,418 | 34,735 | 35,264 | 35,580 |
| Monthly | 31,385 | 33,166 | 34,109 | 35,890 | 36,832 |
| S&P500 (^GSPC): Daily | 4,491 | 4,502 | 4,511 | 4,523 | 4,532 |
| Weekly | 4,349 | 4,432 | 4,476 | 4,559 | 4,604 |
| Monthly | 3,962 | 4,238 | 4,380 | 4,656 | 4,797 |
| Nasdaq (^IXIC): Daily | 14,024 | 14,075 | 14,115 | 14,165 | 14,205 |
| Weekly | 13,496 | 13,811 | 14,003 | 14,317 | 14,509 |
| Monthly | 11,971 | 13,048 | 13,621 | 14,699 | 15,272 |
Here are the formulas:
![]()
Earnings season is either underway or should be starting soon. The sessions could be more volatile.
Mutual funds will begin dividend distributions and rebalancing their portfolios for the approaching year end (starts in late November).
Here's a symbol list of 106 chart and candlestick patterns (13 "investment grade" candle patterns) found in today's securities using my version of Patternz: AXDX, AMED, AEL, AON, APA, AMAT, ADP, BMRN, BCO, CPB, CLS, CVX, CTAS, COP, COST, CSGS, DECK, FANG, EFX, EZPW, FDS, FNV, GME, GPS, IT, GILD, HE, HL, HOLX, HUM, JBHT, HUN, IDA, ILMN, TILE, INTU, IRM, LH, LAMR, LEG, MHO, MTRN, MRK, MU, MUR, NFG, NKE, OGE, OUT, QCOM, RRC, REGN, ROST, SLB, STR, SCCO, SSYS, TPR, TRGP, TFX, TMO, TJX, TDG, UGI, UIS, UNH, WMT, WAT, WWD, IAI, IYK, IYE, BOTZ, ICF, IEV, IXC, MXI, ILF, IGE, IYF, EWK, EWQ, EWG, EWJ, EWP, EWD, EWL, EWT, TUR, DBA, XLP, XLE, XLF, XLV, XAR, USO. Click this link for details (pattern type, start and end dates).
For a list of small patterns (those a few days wide) click this link.
The below industries were the best (rank 1) or worst performing of those I follow.
|
-- Thomas Bulkowski
![]()
$ $ $
Here's a symbol list of 95 chart and candlestick patterns (13 "investment grade" candle patterns) found in today's securities using my version of Patternz: ACN, ALKS, AYX, AMZN, AEE, APH, AMAT, ANET, ADP, AZTA, BMRN, BFH, CBT, CPB, CX, CNP, CHD, CNA, CNO, CNX, CGNX, COP, CR, CTS, FANG, ^DJT, DUK, XOM, EZPW, FDS, GILD, GGG, HP, HUM, JBHT, ILMN, INCY, NSP, IPG, KALU, K, KELYA, KMB, KLIC, LZB, LAMR, LDOS, MHO, M, MTRN, MLKN, NFG, NOV, JWN, NTNX, OXY, OUT, PANW, PTEN, PAYX, PCTY, PXD, PINC, PFG, PGR, QCOM, RL, RRC, REGN, ^GSPC, SHW, STR, SWX, TDC, TJX, TZOO, TREX, UHAL, UGI, UNM, FTEC, SLV, EWP, IBB, DBA, PXJ, SSO, SPY, XLK, USO. Click this link for details (pattern type, start and end dates).
For a list of small patterns (those a few days wide) click this link.
$ $ $
You can find setups based on a Fibonacci retrace by clicking on the link.
The following patterns were found manually, not using Patternz. Mr. Bulkowski has excluded any securities he owns from appearing in the list. However, he may add any of the securities listed to his portfolio at any time, just as you can.
In the table below, the red and green colors are based on the historical breakout direction for the associated chart pattern. If a high and tight flag appears, the start and end dates highlight the flagpole only and not the flag.
For details about the chart patterns, click here.
-- Thomas Bulkowski
![]()
| Symbol | Chart Pattern | Bullish Bearish | Start | End | Industry |
| AYI | Pipe bottom | 10/23/2023 | 10/30/2023 | Furn/Home Furnishings | |
| A | Pipe bottom | 10/23/2023 | 10/30/2023 | Precision Instrument | |
| AON | Pipe bottom | 10/23/2023 | 10/30/2023 | Insurance (Diversified) | |
| APOG | Ugly double bottom | 10/27/2023 | 11/09/2023 | Building Materials | |
| ADM | Head-and-shoulders bottom | 10/06/2023 | 11/08/2023 | Food Processing | |
| ARW | Ugly double bottom | 10/25/2023 | 11/09/2023 | Electronics | |
| ADSK | Double Bottom, Eve and Adam | 10/26/2023 | 11/02/2023 | Computer Software and Svcs | |
| BCPC | Ugly double bottom | 10/27/2023 | 11/09/2023 | Chemical (Specialty) | |
| BALL | Ugly double bottom | 10/23/2023 | 11/10/2023 | Packaging and Container | |
| BIG | Horn top | 10/16/2023 | 10/30/2023 | Retail Store | |
| BMRN | Pipe bottom | 10/30/2023 | 11/06/2023 | Biotechnology | |
| BAH | Pipe bottom | 10/23/2023 | 10/30/2023 | IT Services | |
| BLDR | Ugly double bottom | 10/30/2023 | 11/09/2023 | Retail Building Supply | |
| CLS | Pipe bottom | 10/23/2023 | 10/30/2023 | Electronics | |
| CX | Double Bottom, Adam and Eve | 10/09/2023 | 10/25/2023 | Cement and Aggregates | |
| CENX | Head-and-shoulders bottom | 10/06/2023 | 11/09/2023 | Metals and Mining (Div.) | |
| CGNX | Pipe bottom | 10/23/2023 | 10/30/2023 | Precision Instrument | |
| CMCO | Pipe bottom | 10/23/2023 | 10/30/2023 | Machinery | |
| CAG | Ugly double bottom | 10/06/2023 | 10/23/2023 | Food Processing | |
| GLW | Ugly double bottom | 10/24/2023 | 11/10/2023 | Telecom. Equipment | |
| CSGP | Pipe bottom | 10/23/2023 | 10/30/2023 | Information Services | |
| COST | Triple bottom | 09/27/2023 | 10/27/2023 | Retail Store | |
| CSGS | Pipe bottom | 10/23/2023 | 10/30/2023 | IT Services | |
| DHR | Pipe bottom | 10/23/2023 | 10/30/2023 | Medical Services | |
| EVH | Pipe bottom | 10/23/2023 | 10/30/2023 | Healthcare Information | |
| EXPD | Double Bottom, Eve and Adam | 10/26/2023 | 11/07/2023 | Air Transport | |
| FDX | Head-and-shoulders bottom | 10/13/2023 | 11/09/2023 | Air Transport | |
| FLEX | Pipe bottom | 10/16/2023 | 10/23/2023 | Electronics | |
| FRD | Pipe bottom | 10/23/2023 | 10/30/2023 | Building Materials | |
| GD | Ugly double bottom | 10/06/2023 | 10/24/2023 | Aerospace/Defense | |
| GE | Triple bottom | 10/20/2023 | 11/01/2023 | Diversified Co. | |
| GNW | Double Top, Eve and Adam | 10/13/2023 | 11/03/2023 | Insurance (Life) | |
| HSY | Head-and-shoulders bottom | 10/12/2023 | 11/07/2023 | Food Processing | |
| HOLX | Pipe bottom | 10/23/2023 | 10/30/2023 | Medical Supplies | |
| HD | Head-and-shoulders bottom | 10/06/2023 | 11/10/2023 | Retail Building Supply | |
| HUBG | Ugly double bottom | 10/27/2023 | 11/09/2023 | Trucking/Transp. Leasing | |
| JBHT | Pipe bottom | 10/23/2023 | 10/30/2023 | Trucking/Transp. Leasing | |
| IDXX | Pipe bottom | 10/23/2023 | 10/30/2023 | Drug | |
| ITW | Head-and-shoulders bottom | 09/28/2023 | 11/09/2023 | Metal Fabricating | |
| IIIN | Pipe bottom | 10/23/2023 | 10/30/2023 | Building Materials | |
| IPG | Head-and-shoulders bottom | 10/04/2023 | 11/10/2023 | Advertising | |
| ISRG | Double Bottom, Adam and Eve | 10/20/2023 | 10/30/2023 | Medical Supplies | |
| JBLU | Ugly double bottom | 10/31/2023 | 11/10/2023 | Air Transport | |
| KALU | Double Bottom, Eve and Adam | 10/27/2023 | 11/13/2023 | Metals and Mining (Div.) | |
| KLIC | Pipe bottom | 10/23/2023 | 10/30/2023 | Semiconductor Cap Equip. | |
| LZB | Ugly double bottom | 10/27/2023 | 11/10/2023 | Furn/Home Furnishings | |
| M | Triple bottom | 09/21/2023 | 11/13/2023 | Retail Store | |
| MAN | Ugly double bottom | 10/19/2023 | 11/13/2023 | Human Resources | |
| MCHX | Triangle, symmetrical | 10/25/2023 | 11/16/2023 | Advertising | |
| MTRN | Ugly double bottom | 10/23/2023 | 11/09/2023 | Metals and Mining (Div.) | |
| MDC | Ugly double bottom | 10/27/2023 | 11/09/2023 | Homebuilding | |
| MDT | Double Bottom, Adam and Adam | 10/30/2023 | 11/10/2023 | Medical Supplies | |
| MU | Double Bottom, Adam and Eve | 09/28/2023 | 10/26/2023 | Semiconductor | |
| MS | Ugly double bottom | 10/30/2023 | 11/09/2023 | Securities Brokerage | |
| MLI | Ugly double bottom | 10/20/2023 | 11/09/2023 | Metal Fabricating | |
| NTAP | Pipe bottom | 10/23/2023 | 10/30/2023 | Computers and Peripherals | |
| NWL | Triple bottom | 10/12/2023 | 11/13/2023 | Household Products | |
| JWN | Broadening bottom | 10/09/2023 | 11/16/2023 | Retail Store | |
| PANW | Double Bottom, Eve and Eve | 10/26/2023 | 11/06/2023 | Computer Software and Svcs | |
| PATK | Ugly double bottom | 10/26/2023 | 11/10/2023 | Retail Building Supply | |
| PYPL | Pipe bottom | 10/23/2023 | 10/30/2023 | Financial Services | |
| PSTG | Broadening bottom | 09/20/2023 | 11/15/2023 | Computers and Peripherals | |
| RL | Double Bottom, Eve and Eve | 10/12/2023 | 10/27/2023 | Apparel | |
| RJF | Ugly double bottom | 10/25/2023 | 11/10/2023 | Securities Brokerage | |
| RNG | Pipe bottom | 10/23/2023 | 10/30/2023 | Computer Software and Svcs | |
| ROK | Double Bottom, Adam and Eve | 11/02/2023 | 11/10/2023 | Diversified Co. | |
| RGLD | Triangle, symmetrical | 09/20/2023 | 11/14/2023 | Metals and Mining (Div.) | |
| R | Pipe bottom | 10/23/2023 | 10/30/2023 | Trucking/Transp. Leasing | |
| SAIA | Pipe bottom | 10/23/2023 | 10/30/2023 | Trucking/Transp. Leasing | |
| CRM | Double Bottom, Eve and Eve | 10/03/2023 | 10/26/2023 | E-Commerce | |
| SCHW | Double Bottom, Adam and Eve | 10/06/2023 | 10/25/2023 | Securities Brokerage | |
| SEIC | Pipe bottom | 10/23/2023 | 10/30/2023 | IT Services | |
| SCI | Double Bottom, Adam and Eve | 10/12/2023 | 11/01/2023 | Industrial Services | |
| SKYW | Ugly double bottom | 10/23/2023 | 11/10/2023 | Air Transport | |
| TPR | Broadening bottom | 09/27/2023 | 11/09/2023 | Apparel | |
| TGT | Pipe bottom | 10/02/2023 | 10/09/2023 | Retail Store | |
| TPX | Double Bottom, Adam and Adam | 11/02/2023 | 11/10/2023 | Furn/Home Furnishings | |
| TDC | Broadening bottom | 09/20/2023 | 11/07/2023 | Computer Software and Svcs | |
| TTD | Dead-cat bounce | 11/10/2023 | 11/10/2023 | Advertising | |
| TMO | Pipe bottom | 10/23/2023 | 10/30/2023 | Precision Instrument | |
| TKR | Ugly double bottom | 11/01/2023 | 11/13/2023 | Metal Fabricating | |
| TSCO | Pipe bottom | 10/23/2023 | 10/30/2023 | Retail Building Supply | |
| TRV | Ugly double bottom | 10/24/2023 | 11/15/2023 | Insurance (Prop/Casualty) | |
| VMC | Pipe bottom | 10/23/2023 | 10/30/2023 | Cement and Aggregates | |
| WAT | Pipe bottom | 10/23/2023 | 10/30/2023 | Precision Instrument | |
| WERN | Broadening wedge, descending | 09/20/2023 | 11/15/2023 | Trucking/Transp. Leasing | |
| WU | Ugly double bottom | 10/30/2023 | 11/10/2023 | Financial Services | |
| WSM | Double Bottom, Adam and Adam | 10/26/2023 | 11/10/2023 | Retail (Special Lines) | |
| WOLF | Head-and-shoulders bottom | 10/09/2023 | 11/10/2023 | Semiconductor | |
| WWW | Pipe bottom | 10/09/2023 | 10/16/2023 | Shoe | |
| SOXX | Pipe bottom | 10/23/2023 | 10/30/2023 | Semiconductor | |
| IHI | Head-and-shoulders bottom | 10/13/2023 | 11/10/2023 | Medical Supplies | |
| XLK | Double Bottom, Eve and Adam | 09/27/2023 | 10/26/2023 | IT Services |
![]()
Since I post this the night before, check how the futures are trading before market open. Large moves can affect the opening direction.
$ $ $
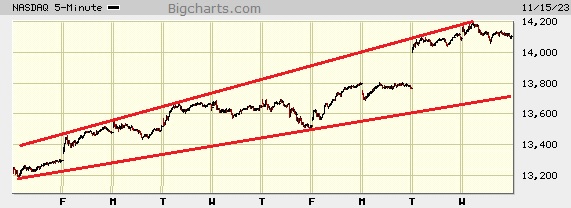
I show a picture of the Nasdaq composite on the 5-minute scale.
I drew two trendlines along the peaks and valleys. Notice that the lines rise and diverge. That behavior forms a chart patterns called an ascending broadening wedge.
Look at the right side of the pattern. Notice how the index has touched the top trendline? If the pattern behaves like it's supposed to, it means that the index should drop to the bottom trendline.
If we use Friday to Tuesday behavior as a guide, then maybe we'll see a dip followed by a return to the top trendline. Of course, the index could breakout upward. Given that we've seen the index rise dramatically in the past week or so, I think the probability suggests a drop here and not an upward breakout.
$ $ $
Here's a symbol list of 149 chart and candlestick patterns (13 "investment grade" candle patterns) found in today's securities using my version of Patternz: ADBE, AMD, AKAM, ALK, ALB, AMZN, AEO, AEL, APH, ACGL, ANET, AVY, BALL, BERY, BBY, BMRN, BKH, BKNG, BAH, CACI, CDNS, CPB, CX, CENX, CIEN, CSCO, CLF, CNO, CAG, GLW, COST, CSGS, DECK, FFIV, FICO, FAST, FISV, FRD, GILD, GL, GMS, GES, HQY, HSIC, HOLX, HUM, IIIN, INTC, TILE, K, KEYS, KMB, KSS, LHX, LDOS, LLY, LPLA, MHO, M, MCHX, MLM, MAS, MTRN, MTRX, META, NOV, NTAP, JWN, NOVT, NTNX, ON, OTEX, ORCL, OUT, OMI, OXM, PANW, PTEN, PSTG, KWR, QCOM, RL, RRC, RJF, REGN, ROL, R, SAND, SMG, SIGI, SKX, LUV, SNPS, TPR, TGT, TDC, TMO, RIG, UPS, VFC, VEEV, VMC, WRB, WSO, WERN, WU, XEL, IYM, IAI, IYC, QTEC, FXI, BOTZ, IGV, MXI, IXN, SLV, EWO, EWC, EEM, EWG, EWH, EPP, EZA, EWY, EWP, EWD, EWT, THD, DBA, PBE, PEJ, PXJ, ROBO, XLP, MGK, VONG. Click this link for details (pattern type, start and end dates).
For a list of small patterns (those a few days wide) click this link.
$ $ $
The following table shows where Fibonacci retrace values of the day's high-low range are plus pivot points, calculated on the Nasdaq composite, sorted by value. When several are near each other (small differences), the area might act as support or resistance.
-- Thomas Bulkowski
![]()
| © 2023 ThePatternSite.com Metric | Value | Diff | Close (within 10% of the high-low range for the day)? |
| Monthly S2 | 12,224.74 | ||
| Monthly S1 | 13,164.29 | 939.55 | |
| Weekly S2 | 13,414.25 | 249.96 | |
| Monthly Pivot | 13,483.41 | 69.16 | |
| Weekly S1 | 13,759.04 | 275.63 | |
| Weekly Pivot | 13,780.79 | 21.74 | |
| Daily S2 | 13,985.97 | 205.19 | |
| Daily S1 | 14,044.91 | 58.93 | |
| Low | 14,060.70 | 15.79 | |
| Close | 14,103.84 | 43.14 | |
| 61.8% Down from Intraday High | 14,111.76 | 7.92 | Yes! The 61.8% Down from Intraday High is close to the Close. |
| Daily Pivot | 14,119.63 | 7.88 | Yes! The Daily Pivot is close to the 61.8% Down from Intraday High. |
| Weekly R1 | 14,125.58 | 5.95 | Yes! The Weekly R1 is close to the Daily Pivot. |
| 50% Down from Intraday High | 14,127.53 | 1.95 | Yes! The 50% Down from Intraday High is close to the Weekly R1. |
| 38.2% Down from Intraday High | 14,143.30 | 15.77 | |
| Open | 14,147.27 | 3.97 | Yes! The Open is close to the 38.2% Down from Intraday High. |
| Weekly R2 | 14,147.33 | 0.06 | Yes! The Weekly R2 is close to the Open. |
| Daily R1 | 14,178.57 | 31.24 | |
| High | 14,194.36 | 15.79 | |
| Daily R2 | 14,253.29 | 58.93 | |
| Monthly R1 | 14,422.96 | 169.67 | |
| Monthly R2 | 14,742.08 | 319.12 |
This is a picture of the chart pattern indicator on the daily scale. The indicator is the line chart below a chart of the S&P 500 composite.
I highlight the gap at A. One can argue that it's a breakaway gap because it breaks away from a congestion area. That area is just below the gap and it is about a week long. It's a flag pattern. I show the flag by two parallel red lines.
That was my first thought (breakaway gap). However, I know that exhaustion gaps can be quite tall. Does the height of this gap qualify? If it does, then look for a quick and probably violent reversal.
If the answer is no, then look for the index to continue higher.
The red line is the percentage of stocks at least 20% below their 1-year high (plotted upside down). The blue line is the average percentage drop of stocks below their 1-year high (plotted upside down).
On Tuesday, 40% of stocks in my database are in bear market territory (down at least 20% from their 1-year high).A week ago, it was 46%.The fewest was 26% on 07/31/2023.And the most was 57% on 12/19/2022.
The 518 stocks in my database are down an average of 19% from their yearly high.A week ago, the average was 21%.The peak was 14% on 07/31/2023.And the bottom was 27% on 12/19/2022.
Both the red and blue lines show improvement compared to a week ago. No surprise there, given Tuesday's big gain.
Given that both charts are bullish, I expect the index to see price continuing to move higher. If I'm wrong, then look for a quick and sharp reversal. If it happens, it should occur quickly, on Wednesday.
$ $ $
Here's a symbol list of 355 chart and candlestick patterns (13 "investment grade" candle patterns) found in today's securities using my version of Patternz: MMM, ANF, AXDX, ACN, AYI, ADBE, AEIS, AMD, AES, AFL, A, ATSG, AKAM, ALK, AA, AYX, AMZN, AEE, AEO, AEP, AEL, AXP, AMWD, AME, APH, ANIK, APOG, AAPL, AMAT, ARCB, ACGL, AWI, ARW, ASH, ADSK, ADP, AVY, BALL, BSET, BECN, BZH, BERY, BMRN, BKH, BOOT, BAH, BRC, BCO, BR, BLDR, CBT, CDNS, CE, CLS, CX, CNP, CENX, CIEN, CTAS, CLF, CNO, CGNX, CTSH, CMCO, CMTL, CAG, GLW, CSGP, COST, CROX, CCRN, CSGS, CTS, DHR, DDS, DOV, DTE, DUK, EXP, EMN, EBAY, ECL, EIX, EME, WIRE, EPAM, EFX, EVRG, EVH, EXC, EXPI, EXPD, FDS, FARO, FDX, FIS, FIVN, FLEX, FLS, FORM, FRD, GPS, IT, GNW, GILD, GMS, GS, GOOGL, GGG, GFF, GES, HBI, HE, HQY, HSII, HON, DHI, HOV, HUM, HUN, HURC, IDA, IDXX, ITW, ILMN, INCY, IBP, IIIN, ITGR, IPAR, TILE, IPG, INTU, JKHY, JBLU, KBH, KEYS, KMB, KLAC, KSS, KLIC, LHX, LZB, LRCX, LANC, LEG, LEN, LNC, RAMP, LOW, LPLA, LXU, MHO, MTSI, M, MANH, MCHX, MKTX, MRTN, MLM, MAS, MA, MTRN, MTRX, MDC, META, MLKN, MS, MOS, MLI, NBR, NOV, NTAP, NEU, JWN, NWPX, NTNX, OGE, OLN, ASGN, OTEX, PKG, PANW, PKE, PATK, PAYX, PYPL, PRFT, PETS, PNW, PLXS, POR, PPG, PPL, PINC, PRU, PEG, PHM, PSTG, QTWO, KWR, QCOM, DGX, RMBS, RRC, RJF, REGN, RGS, RNG, RHI, ROG, ROL, ROST, RES, R, SAIA, CRM, SBH, SEE, SEIC, SIGI, SCI, NOW, SHW, SHOP, SLGN, SKX, SKYW, SMAR, SO, SWX, SPSC, SCS, SRDX, SNPS, TPR, TRGP, TDY, TDC, TER, TEVA, TXN, TKR, TJX, TOL, TREX, TWLO, UHAL, VFC, VMI, VRTX, VMC, WAT, WSO, WLK, WMB, WSC, WDAY, XEL, IYM, IAI, IYC, ITB, IDU, DDM, FTEC, FDN, QTEC, FXL, FXI, BOTZ, QQQ, IAT, IEV, IGV, IXC, MXI, IXN, ILF, SOXX, SLV, IYF, IHI, EWO, EWK, EWZ, EWC, ECH, EEM, EWQ, EWG, EWH, EWI, EWJ, EWW, EZA, EWP, EWD, EWL, EWT, THD, TUR, QLD, PPA, DBA, PEJ, PHO, SSO, ROBO, XLY, XLP, XLE, XLF, GLD, XHB, XLI, XLB, XRT, SPY, XAR, XLK, XLU, SMH, VIS, VAW, MGK, VONG. Click this link for details (pattern type, start and end dates).
For a list of small patterns (those a few days wide) click this link.
-- Thomas Bulkowski
![]()
$ $ $
I show another slider trading quiz featuring Pennants.
$ $ $
Here's a symbol list of 121 chart and candlestick patterns (13 "investment grade" candle patterns) found in today's securities using my version of Patternz: DDD, AXDX, AYI, ADBE, ADTN, A, AEL, AON, APA, ARCB, ADSK, BMI, BIG, BIO, BA, BOOT, BAH, BR, CDNS, CLS, CNP, CENX, CHD, CGNX, CL, CMCO, CAG, CSGP, COTY, CSGS, CTS, CW, DHR, ^DJT, EXP, EPAM, EVH, FICO, FDX, FIS, FRD, GNW, GPN, GPRO, HE, HOLX, DHI, JBHT, HUN, IDXX, INCY, IIIN, JKHY, K, KLIC, RAMP, LPLA, MAN, MA, MTRX, META, MGEE, MU, MYGN, NTAP, NWPX, NVDA, ORI, PYPL, PFE, QTWO, DGX, RMBS, RNG, RCKY, R, SAIA, SEIC, SLGN, STR, SKX, SO, SWX, SR, SPSC, SRDX, TMO, TSCO, TZOO, TWLO, VFC, VRSN, VMC, WAT, WEX, WOLF, ITA, IEZ, FDN, QTEC, FXL, IYZ, SOXX, ECH, EWY, THD, TUR, QLD, PPA, DBA, SSO, ROBO, SMH, MGK. Click this link for details (pattern type, start and end dates).
For a list of small patterns (those a few days wide) click this link.
$ $ $
The following table shows where Fibonacci retrace values of the day's high-low range are plus pivot points, calculated on the Dow industrials, sorted by value. When several are near each other (small differences), the area might act as support or resistance.
-- Thomas Bulkowski
![]()
| © 2023 ThePatternSite.com Metric | Value | Diff | Close (within 10% of the high-low range for the day)? |
| Monthly S2 | 31,675.32 | ||
| Monthly S1 | 33,006.59 | 1,331.28 | |
| Monthly Pivot | 33,658.48 | 651.88 | |
| Weekly S2 | 33,718.74 | 60.27 | |
| Weekly S1 | 34,028.30 | 309.56 | |
| Daily S2 | 34,116.48 | 88.17 | |
| Weekly Pivot | 34,169.33 | 52.86 | |
| Low | 34,205.81 | 36.48 | |
| Daily S1 | 34,227.17 | 21.36 | |
| Open | 34,259.25 | 32.08 | |
| 61.8% Down from Intraday High | 34,282.22 | 22.97 | |
| 50% Down from Intraday High | 34,305.82 | 23.60 | |
| Daily Pivot | 34,316.51 | 10.68 | Yes! The Daily Pivot is close to the 50% Down from Intraday High. |
| 38.2% Down from Intraday High | 34,329.43 | 12.92 | Yes! The 38.2% Down from Intraday High is close to the Daily Pivot. |
| Close | 34,337.87 | 8.44 | Yes! The Close is close to the 38.2% Down from Intraday High. |
| High | 34,405.84 | 67.97 | |
| Daily R1 | 34,427.20 | 21.36 | |
| Weekly R1 | 34,478.90 | 51.70 | |
| Daily R2 | 34,516.54 | 37.64 | |
| Weekly R2 | 34,619.92 | 103.39 | |
| Monthly R1 | 34,989.75 | 369.83 | |
| Monthly R2 | 35,641.64 | 651.88 |
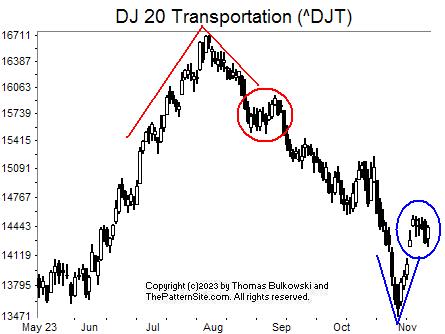
I show the Dow transports on the daily scale.
The red lines highlight a V-top, probably with an extension (called an extended V-top).
I circled the extension in red. It seems distant from the peak, so maybe its just a retrace in a downtrend.
If you were to see this V-top without seeing what happened below the red circle, you'd be hard pressed to suggest that the index would drop back to the launch price. The launch price is the price where the uptrend began in June. However, the transports did drop back to the launch price, shown by an extended V-bottom (in blue).
I circled the extension. I'd say the uptrend is going to resume this week. The index is sitting atop a continuation gap, which will show meager support but it might be enough to send the index higher. That's my guess (that the index will rise).
![]()
The following is a brief review of how the markets performed over time. The numbers refer to the close-to-close move in the Dow industrials.
Many options expire this week, so traders will be looking to close out their positions, and that suggests increased volatility (large daily price swings).
![]()
The following is based on an SFO article in December 2004 by John Seekinger, titled, "Take a two-dimensional approach." He offers these tips.
| Index | S2 | S1 | Pivot | R1 | R2 |
| Dow Industrials (^DJI): Daily | 33,762 | 34,022 | 34,166 | 34,427 | 34,571 |
| Weekly | 33,700 | 33,992 | 34,151 | 34,442 | 34,602 |
| Monthly | 31,657 | 32,970 | 33,640 | 34,953 | 35,623 |
| S&P500 (^GSPC): Daily | 4,331 | 4,373 | 4,396 | 4,438 | 4,460 |
| Weekly | 4,318 | 4,367 | 4,392 | 4,441 | 4,466 |
| Monthly | 3,998 | 4,207 | 4,312 | 4,521 | 4,627 |
| Nasdaq (^IXIC): Daily | 13,473 | 13,635 | 13,719 | 13,882 | 13,965 |
| Weekly | 13,312 | 13,555 | 13,679 | 13,922 | 14,045 |
| Monthly | 12,123 | 12,960 | 13,382 | 14,219 | 14,640 |
Here are the formulas:
![]()
Earnings season is either underway or should be starting soon. The sessions could be more volatile.
Mutual funds will begin dividend distributions and rebalancing their portfolios for the approaching year end (starts in late November).
Here's a symbol list of 156 chart and candlestick patterns (13 "investment grade" candle patterns) found in today's securities using my version of Patternz: DDD, AXDX, AYI, ADBE, A, ALRM, AMZN, AON, AMAT, ATR, AWI, ADSK, BIG, BIO, BOOT, BAH, BR, CDNS, CAL, CLS, CENX, CLNE, CGNX, CMCO, CAG, CSGP, COST, COTY, CSGS, CTS, DHR, DECK, XRAY, ^DJT, EXP, EPAM, EVH, EZPW, FICO, FDX, FIS, FRD, GNW, GPN, GOOGL, GPRO, GFF, HL, HSIC, HOLX, DHI, JBHT, IDXX, ILMN, IIIN, JKHY, KLIC, RAMP, MRTN, MA, MRK, META, MU, MYGN, NTAP, NJR, NKE, NWPX, NUS, NVDA, ON, OTEX, ORCL, PYPL, PETS, PFE, QTWO, DGX, RMBS, RRC, RTX, REGN, RGS, RNG, R, SAIA, CRM, SEE, SEIC, NOW, SLGN, SKX, LUV, SR, SPSC, SSYS, TDC, TER, TXN, TTD, TMO, TSCO, TWLO, UIS, UPS, VFC, VLO, VEEV, VRSN, V, VMC, WAT, WEX, WSM, WSC, WOLF, FDN, QTEC, FXL, FXI, IYZ, SOXX, EWC, EWH, EWM, EPP, EWY, EWT, THD, QLD, DBA, SSO, ROBO, GLD, SMH, MGK. Click this link for details (pattern type, start and end dates).
For a list of small patterns (those a few days wide) click this link.
The below industries were the best (rank 1) or worst performing of those I follow.
|
-- Thomas Bulkowski
![]()
$ $ $
Here's a symbol list of 301 chart and candlestick patterns (13 "investment grade" candle patterns) found in today's securities using my version of Patternz: DDD, ANF, AXDX, ACIW, AYI, ADBE, AMD, A, AA, ALKS, AEE, AEP, AXP, AFG, AON, APOG, ATR, ADSK, AVNT, AZTA, BMI, BCPC, BECN, BIG, BIO, BMRN, BA, BOOT, BAH, BRC, BFH, BR, BBW, BG, CBT, CDNS, CAL, CLS, CENX, CDAY, CHKP, CLNE, CGNX, CTSH, CL, CMCO, CMTL, CAG, CXW, CSGP, COTY, CCRN, CSGS, CTS, DHR, ^DJT, D, BOOM, EXP, ELV, WIRE, EPAM, EVH, EXC, EXPD, FICO, FARO, FDX, FIS, FLEX, FMC, FORM, FTNT, FRD, GPN, GS, GOOGL, GPRO, GES, HTLD, HELE, HP, HSIC, HOLX, DHI, HOV, HUBG, JBHT, IEX, IDXX, INCY, IIIN, INTC, IPAR, TILE, NVTA, IRM, JKHY, JAZZ, KEYS, KLAC, KLIC, LDOS, LEN, RAMP, LPLA, MTSI, MGY, MKTX, MA, MTRX, MDT, MRK, MRCY, META, MU, MLKN, MOS, MYGN, NFG, NTAP, NJR, NWL, NEU, NEE, NKE, NI, NTNX, NVDA, OXY, OTEX, OR, OUT, PKG, PANW, PATK, PYPL, PRFT, PFE, PINC, PHM, QTWO, KWR, DGX, RMBS, RRC, RTX, REGN, RGS, RGA, RNG, RES, R, SAIA, CRM, SLB, SAIC, SEE, SEIC, SRE, SHW, SKX, SKYW, SO, LUV, SWX, SR, SPSC, SXI, SSYS, TECH, TDOC, TER, TXN, TTD, TMO, TSCO, TDG, TREX, TWLO, UHAL, UIS, UPS, VRSN, VRTX, V, VMC, WRB, WAT, WSO, WERN, WLK, WEX, WSM, WSC, WOLF, WWD, XEL, IYK, IYC, IHE, FTEC, FDN, QTEC, FXL, BOTZ, ICF, IYH, IHF, IYZ, IEV, IGV, MXI, IXN, SOXX, EWH, EIS, EWM, EWY, EWL, EWT, QLD, IBB, DBA, PBE, SSO, ROBO, XLP, XLF, XLV, XHB, XLI, XLB, XAR, XLK, SMH, VHT, VIS, VAW, MGK, VONG. Click this link for details (pattern type, start and end dates).
For a list of small patterns (those a few days wide) click this link.
$ $ $
You can find setups based on a Fibonacci retrace by clicking on the link.
The following patterns were found manually, not using Patternz. Mr. Bulkowski has excluded any securities he owns from appearing in the list. However, he may add any of the securities listed to his portfolio at any time, just as you can.
In the table below, the red and green colors are based on the historical breakout direction for the associated chart pattern. If a high and tight flag appears, the start and end dates highlight the flagpole only and not the flag.
For details about the chart patterns, click here.
-- Thomas Bulkowski
![]()
| Symbol | Chart Pattern | Bullish Bearish | Start | End | Industry |
| ADBE | Pipe bottom | 10/23/2023 | 10/30/2023 | Computer Software and Svcs | |
| ADTN | Dead-cat bounce | 11/07/2023 | 11/07/2023 | Telecom. Equipment | |
| AMD | Double Bottom, Eve and Eve | 09/25/2023 | 10/26/2023 | Semiconductor | |
| APD | Double Top, Eve and Adam | 10/12/2023 | 11/03/2023 | Chemical (Diversified) | |
| ATSG | Dead-cat bounce | 11/07/2023 | 11/07/2023 | Air Transport | |
| AAPL | Double Bottom, Adam and Eve | 09/28/2023 | 10/26/2023 | Computers and Peripherals | |
| ADSK | Pipe bottom | 10/23/2023 | 10/30/2023 | Computer Software and Svcs | |
| CDNS | Pipe bottom | 10/23/2023 | 10/30/2023 | Computer Software and Svcs | |
| CPB | Pipe bottom | 10/02/2023 | 10/09/2023 | Food Processing | |
| CX | Pipe bottom | 10/02/2023 | 10/09/2023 | Cement and Aggregates | |
| CDAY | Double Top, Adam and Eve | 09/12/2023 | 10/11/2023 | Information Services | |
| CI | Double Top, Eve and Adam | 10/17/2023 | 11/02/2023 | Medical Services | |
| CAG | Triangle, ascending | 10/10/2023 | 11/08/2023 | Food Processing | |
| COTY | Pipe bottom | 10/23/2023 | 10/30/2023 | Toiletries/Cosmetics | |
| CTS | Pipe bottom | 10/23/2023 | 10/30/2023 | Electronics | |
| D | Double Bottom, Adam and Eve | 10/06/2023 | 10/23/2023 | Electric Utility (East) | |
| DTE | Broadening bottom | 10/11/2023 | 11/03/2023 | Electric Utility (Central) | |
| EXP | Pipe bottom | 10/23/2023 | 10/30/2023 | Cement and Aggregates | |
| EME | Pipe bottom | 10/16/2023 | 10/23/2023 | Industrial Services | |
| WIRE | Pipe bottom | 10/16/2023 | 10/23/2023 | Metals and Mining (Div.) | |
| EPAM | Pipe bottom | 10/23/2023 | 10/30/2023 | IT Services | |
| FICO | Pipe bottom | 10/23/2023 | 10/30/2023 | IT Services | |
| FIS | Pipe bottom | 10/23/2023 | 10/30/2023 | Computer Software and Svcs | |
| FISV | Head-and-shoulders bottom | 10/03/2023 | 10/30/2023 | IT Services | |
| FTNT | Dead-cat bounce | 11/03/2023 | 11/03/2023 | Computer Software and Svcs | |
| IT | Double Bottom, Adam and Adam | 08/18/2023 | 10/27/2023 | IT Services | |
| GPRO | Pipe bottom | 10/23/2023 | 10/30/2023 | Electronics | |
| GGG | Pipe bottom | 10/16/2023 | 10/23/2023 | Machinery | |
| GFF | Triple bottom | 09/19/2023 | 10/23/2023 | Building Materials | |
| HBI | Double Top, Eve and Eve | 10/19/2023 | 11/03/2023 | Apparel | |
| PODD | Double Bottom, Adam and Adam | 10/12/2023 | 11/01/2023 | Medical Supplies | |
| NVTA | Dead-cat bounce | 11/09/2023 | 11/09/2023 | Medical Services | |
| JKHY | Pipe bottom | 10/23/2023 | 10/30/2023 | IT Services | |
| LANC | Pipe top | 10/09/2023 | 10/16/2023 | Food Processing | |
| RAMP | Pipe bottom | 10/23/2023 | 10/30/2023 | Computer Software and Svcs | |
| L | Double Bottom, Adam and Adam | 10/23/2023 | 10/30/2023 | Insurance (Prop/Casualty) | |
| MA | Pipe bottom | 10/23/2023 | 10/30/2023 | Financial Services | |
| META | Pipe bottom | 10/23/2023 | 10/30/2023 | E-Commerce | |
| MYGN | Pipe bottom | 10/23/2023 | 10/30/2023 | Biotechnology | |
| NKE | Ugly double bottom | 09/28/2023 | 10/27/2023 | Shoe | |
| NVDA | Pipe bottom | 10/23/2023 | 10/30/2023 | Semiconductor | |
| OR | Head-and-shoulders bottom | 09/27/2023 | 10/12/2023 | Metals and Mining (Div.) | |
| PKG | Pipe bottom | 10/16/2023 | 10/23/2023 | Packaging and Container | |
| PNW | Triple top | 10/17/2023 | 11/02/2023 | Electric Utility (West) | |
| QTWO | Pipe bottom | 10/23/2023 | 10/30/2023 | E-Commerce | |
| RMBS | Pipe bottom | 10/23/2023 | 10/30/2023 | Semiconductor Cap Equip. | |
| RCKY | Flag, high and tight | 10/31/2023 | 11/08/2023 | Shoe | |
| ROL | Pipe bottom | 10/16/2023 | 10/23/2023 | Industrial Services | |
| SKX | Pipe bottom | 10/23/2023 | 10/30/2023 | Shoe | |
| SKYW | Pipe bottom | 10/16/2023 | 10/23/2023 | Air Transport | |
| SPSC | Pipe bottom | 10/23/2023 | 10/30/2023 | E-Commerce | |
| TWLO | Pipe bottom | 10/23/2023 | 10/30/2023 | E-Commerce | |
| UHAL | Pipe bottom | 10/23/2023 | 10/30/2023 | Trucking/Transp. Leasing | |
| UGI | Double Bottom, Adam and Eve | 10/06/2023 | 10/23/2023 | Natural Gas (Distributor) | |
| WPM | Ugly double bottom | 10/03/2023 | 10/26/2023 | Metals and Mining (Div.) | |
| FDN | Pipe bottom | 10/23/2023 | 10/30/2023 | Internet | |
| QTEC | Pipe bottom | 10/23/2023 | 10/30/2023 | Electronics |
![]()
Since I post this the night before, check how the futures are trading before market open. Large moves can affect the opening direction.
$ $ $
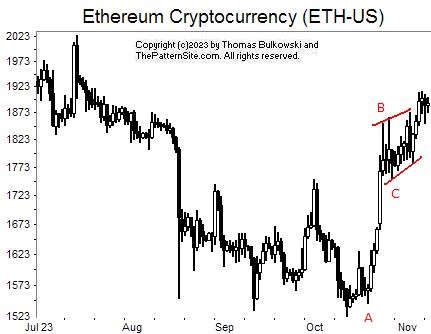
I show a picture of Ethereum (ETH-USD) on the daily scale.
BC is a flag. The flag pole, which I consider vital to the pattern, begins at A. It rises to B. That's the height of the pattern which I'll use to help predict a target.
The height, eyeballing the numbers, is 1850 - 1550 or 300 points. Add the height to C, 1750, gives a target of 2050. That's off the top end of the scale. It likely won't reach that because flags often only reach the target 46% of the time, even though I'm conservative by using the bottom start of the flag (versus the bottom end, which is about 1800).
Before it can try to reach its target, it has to breakout upward from the knot where it's at now. It could breakout downward, pullback, and then soar, of course.
This looks like it'll move higher but the ride may be bumpy.
$ $ $
Here's a symbol list of 280 chart and candlestick patterns (13 "investment grade" candle patterns) found in today's securities using my version of Patternz: DDD, MMM, AYI, ADBE, A, AKAM, ALRM, ALKS, AEP, AEL, AON, APA, APOG, AAPL, ARCB, AGO, ATO, ADSK, AZTA, BMI, BCPC, BIG, BIO, BIIB, BOOT, BAH, BFH, BR, BBW, CDNS, CAL, CLS, CNP, CENX, CRL, CVX, CINF, CLNE, CGNX, CTSH, CMCO, CMTL, ED, COP, CSGP, COTY, CSGS, CTS, CMI, CW, DHR, DVN, ^DJU, ^DJT, DUK, EXP, EBAY, EIX, ELV, EOG, EPAM, EQT, EG, EVH, EXPD, FICO, FDX, FIS, FMC, FWRD, FNV, FCX, FRD, GD, GILD, GPN, GPRO, GES, HIG, HELE, HP, HOLX, HUM, JBHT, IDA, IEX, IDXX, INCY, NSP, IIIN, INTC, IBKR, NVTA, JKHY, JAZZ, KALU, KEYS, KLAC, KLIC, LEG, RAMP, L, LXU, MTSI, MGY, MRO, MKTX, MA, MTDR, MTRN, MTRX, MDC, MDT, MRK, MRCY, META, MU, MS, MUR, MYGN, NBR, NFG, NOV, NTAP, NJR, NWL, NEE, NKE, NI, JWN, NUS, NVDA, OGE, OMCL, PKG, PANW, PATK, PTEN, PYPL, PRFT, PCG, PNW, POR, PHM, QTWO, DGX, RMBS, RRC, REGN, RGS, RNG, RCKY, ROG, RGLD, R, SAIA, SAIC, SEIC, SRE, NOW, STR, SKX, SKYW, SCCO, LUV, SR, SPSC, SSYS, SUM, SRDX, TRGP, TECH, TDOC, TER, TXN, TTD, TMO, TSCO, RIG, TG, TWLO, UHAL, UIS, UPS, VLO, VRSN, VRTX, VC, VMC, WRB, WAT, WERN, WEX, WPM, WMB, WSM, WOLF, XEL, IYM, IYK, IYE, IHE, IDU, FDN, QTEC, FXL, IYH, IHF, IYZ, IXC, MXI, IXN, SOXX, IGE, IEO, EWC, EWH, EWJ, EWM, EWW, EPP, EWS, EWY, EWT, EWU, QLD, IBB, DBA, PBE, PXJ, SSO, ROBO, XLP, XLE, XLV, XLU, UNG, USO, SMH, VHT. Click this link for details (pattern type, start and end dates).
For a list of small patterns (those a few days wide) click this link.
$ $ $
The following table shows where Fibonacci retrace values of the day's high-low range are plus pivot points, calculated on the Nasdaq composite, sorted by value. When several are near each other (small differences), the area might act as support or resistance.
-- Thomas Bulkowski
![]()
| © 2023 ThePatternSite.com Metric | Value | Diff | Close (within 10% of the high-low range for the day)? |
| Monthly S2 | 12,132.52 | ||
| Weekly S2 | 12,458.70 | 326.17 | |
| Monthly S1 | 12,891.47 | 432.77 | |
| Weekly S1 | 13,054.55 | 163.09 | |
| Weekly Pivot | 13,287.42 | 232.86 | |
| Monthly Pivot | 13,302.80 | 15.39 | |
| Daily S2 | 13,525.00 | 222.19 | |
| Low | 13,573.58 | 48.58 | |
| Daily S1 | 13,587.70 | 14.12 | |
| 61.8% Down from Intraday High | 13,616.09 | 28.39 | |
| 50% Down from Intraday High | 13,629.22 | 13.13 | |
| Daily Pivot | 13,636.29 | 7.06 | Yes! The Daily Pivot is close to the 50% Down from Intraday High. |
| 38.2% Down from Intraday High | 13,642.36 | 6.07 | Yes! The 38.2% Down from Intraday High is close to the Daily Pivot. |
| Close | 13,650.41 | 8.05 | Yes! The Close is close to the 38.2% Down from Intraday High. |
| Open | 13,660.22 | 9.81 | Yes! The Open is close to the Close. |
| High | 13,684.87 | 24.65 | |
| Daily R1 | 13,698.99 | 14.12 | |
| Daily R2 | 13,747.58 | 48.58 | |
| Weekly R1 | 13,883.27 | 135.70 | |
| Monthly R1 | 14,061.75 | 178.47 | |
| Weekly R2 | 14,116.14 | 54.39 | |
| Monthly R2 | 14,473.08 | 356.95 |
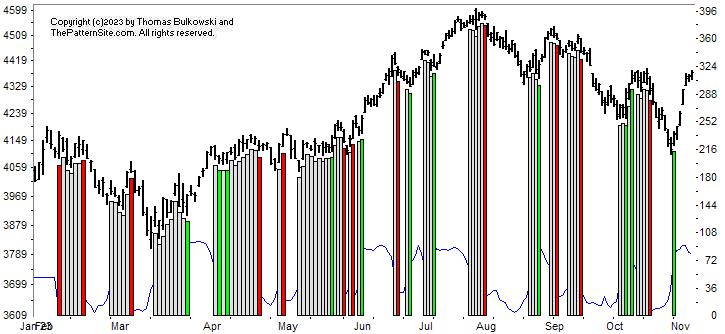
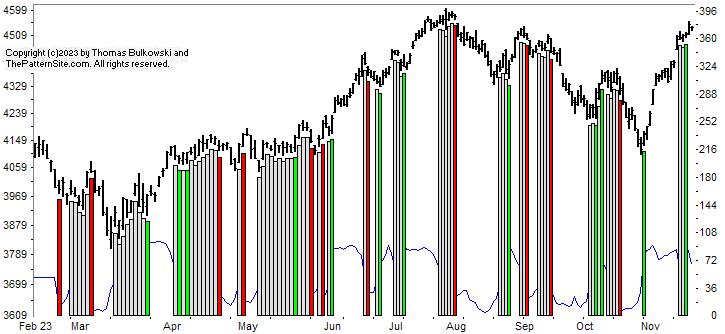
This is a picture of the chart pattern indicator on the daily scale. The indicator is the line chart below a chart of the S&P 500 composite.
As the chart shows, the vertical green bar on the far right of the chart shows a strong upward move.
The index is hitting overhead resistance now, so I expect a retrace. Indeed, you can see the thin blue line at the bottom of the chart (the CPI line) turning down already.
The red line is the percentage of stocks at least 20% below their 1-year high (plotted upside down). The blue line is the average percentage drop of stocks below their 1-year high (plotted upside down).
On Tuesday, 45% of stocks in my database are in bear market territory (down at least 20% from their 1-year high).A week ago, it was 51%.The fewest was 26% on 07/31/2023.And the most was 59% on 11/09/2022.
The 520 stocks in my database are down an average of 21% from their yearly high.A week ago, the average was 24%.The peak was 14% on 07/31/2023.And the bottom was 28% on 11/09/2022.
Both lines prospered over the past week, compared to a week ago.
However, just like the CPI line, the two lines here (red and blue), are turning down.
Both charts are bullish but warning of a downturn coming. I expect a retrace will take the index lower for a few days, maybe a week.
$ $ $
Here's a symbol list of 275 chart and candlestick patterns (13 "investment grade" candle patterns) found in today's securities using my version of Patternz: DDD, AYI, ADBE, ADTN, AFL, A, APD, ATSG, AKAM, AA, AYX, AMWD, AME, AON, AMAT, AWI, ASH, ATO, ADSK, AZTA, BCPC, BERY, BBY, BIG, BIO, BIIB, BMRN, BA, BOOT, BAH, BFH, BR, CBT, CDNS, CAL, CLS, COR, CENX, CRL, CHKP, CVX, CHS, CLNE, CGNX, CTSH, CMCO, CMTL, GLW, CSGP, COTY, CSGS, CTS, CMI, DHR, DVN, DRQ, EXP, EBAY, EMR, EPAM, EQT, EVH, EXPD, XOM, FICO, FDX, FIS, FISV, FIVN, FMC, FORM, FTNT, FNV, FDP, FRD, GD, GPN, GL, GPRO, GFF, HIG, HELE, HP, HSIC, HOLX, JBHT, IEX, IDXX, INCY, INFN, IIIN, INTU, ISRG, NVTA, JKHY, KALU, KBH, KELYA, KEYS, KFRC, KLAC, KLIC, LH, LRCX, LLY, RAMP, MTSI, M, MRO, MKTX, MA, MTRX, MDT, MRK, META, MGEE, MU, MSFT, MOS, MYGN, NBR, NTAP, NJR, NWL, NOVT, NVDA, OXY, OLN, PANW, PTEN, PYPL, PXD, PRU, QTWO, QCOM, DGX, RL, RMBS, RRC, RJF, REGN, RGS, RNG, ROG, ROL, ROP, RGLD, RES, R, SAIA, CRM, SAND, SAIC, SEE, SEIC, NOW, STR, SKX, SMAR, LUV, SR, SPSC, SXI, SSYS, TPR, TDOC, TDC, TER, TXN, TTD, TMO, TKR, TSCO, TZOO, TWLO, UHAL, UIS, UPS, VLO, VMI, VECO, MDRX, VRSN, V, VMC, WAT, WSO, WEX, WMB, WSM, WOLF, WWD, WDAY, IYE, ITB, IHE, FTEC, FDN, QTEC, FXL, ICF, IYH, IAT, IYZ, IGV, IXN, SOXX, IHI, EWA, EWK, EWZ, EIS, EWI, EWJ, EWW, EWY, QLD, IBB, DBA, PBE, PEJ, PXJ, SSO, ROBO, XLE, GLD, XLV, XLK, UNG, USO, SMH, VHT, VIS, VONG. Click this link for details (pattern type, start and end dates).
For a list of small patterns (those a few days wide) click this link.
-- Thomas Bulkowski
![]()
$ $ $
I show another slider trading quiz featuring Triangles, descending..
$ $ $
Here's a symbol list of 141 chart and candlestick patterns (13 "investment grade" candle patterns) found in today's securities using my version of Patternz: AFL, APD, ALK, AA, AYX, AMED, AEO, AMGN, ARCB, ASH, BSET, BECN, BZH, BERY, BIG, BA, BKNG, BBW, CBT, CLS, CX, CHKP, CSCO, CLF, CNO, GLW, CMI, CW, XRAY, DSGR, DRQ, EME, WIRE, EXPI, EXPD, FDS, FLEX, FORM, FRD, GL, GGG, HIG, HTLD, HP, HOV, IEX, IDXX, ITGR, IPAR, IRM, KELYA, KLAC, L, MHO, M, MCHX, MOS, NBR, NJR, NWL, NXGN, NWPX, NUS, OXY, ON, PKG, PATK, PTEN, PCTY, PYPL, PNW, PINC, PRU, PSTG, DGX, RL, RJF, ROK, ROL, RES, SMG, SEE, SMTC, STR, SKYW, SMAR, LUV, SCS, TPR, TGT, TDOC, TFX, TKR, TZOO, TWLO, SLCA, MDRX, WRB, WEX, WMB, WWD, ZBRA, IYM, IYC, IHE, FTEC, ICF, IAT, IYZ, IXC, MXI, IGE, IEO, IHI, EWA, EWK, ECH, EEM, EWH, EWI, EWM, EWS, EWY, EWT, DBA, PXJ, XAR, VIS. Click this link for details (pattern type, start and end dates).
For a list of small patterns (those a few days wide) click this link.
$ $ $
The following table shows where Fibonacci retrace values of the day's high-low range are plus pivot points, calculated on the Dow industrials, sorted by value. When several are near each other (small differences), the area might act as support or resistance.
-- Thomas Bulkowski
![]()
| © 2023 ThePatternSite.com Metric | Value | Diff | Close (within 10% of the high-low range for the day)? |
| Monthly S2 | 31,692.47 | ||
| Weekly S2 | 31,972.92 | 280.45 | |
| Monthly S1 | 32,894.16 | 921.24 | |
| Weekly S1 | 33,034.39 | 140.23 | |
| Monthly Pivot | 33,528.90 | 494.51 | |
| Weekly Pivot | 33,599.01 | 70.11 | |
| Daily S2 | 33,906.74 | 307.73 | |
| Low | 33,989.72 | 82.98 | |
| Daily S1 | 34,001.30 | 11.58 | Yes! The Daily S1 is close to the Low. |
| 61.8% Down from Intraday High | 34,057.54 | 56.24 | |
| 50% Down from Intraday High | 34,078.49 | 20.95 | |
| Daily Pivot | 34,084.28 | 5.79 | Yes! The Daily Pivot is close to the 50% Down from Intraday High. |
| Open | 34,092.61 | 8.33 | Yes! The Open is close to the Daily Pivot. |
| Close | 34,095.86 | 3.25 | Yes! The Close is close to the Open. |
| 38.2% Down from Intraday High | 34,099.44 | 3.58 | Yes! The 38.2% Down from Intraday High is close to the Close. |
| High | 34,167.26 | 67.82 | |
| Daily R1 | 34,178.84 | 11.58 | Yes! The Daily R1 is close to the High. |
| Daily R2 | 34,261.82 | 82.98 | |
| Weekly R1 | 34,660.48 | 398.66 | |
| Monthly R1 | 34,730.59 | 70.11 | |
| Weekly R2 | 35,225.10 | 494.51 | |
| Monthly R2 | 35,365.33 | 140.23 |
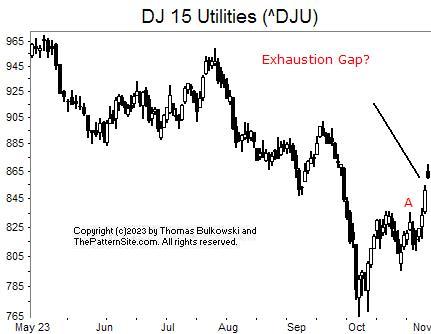
I show the Dow utilities on the daily scale.
I highlighted a gap on the chart but it appears on the charts of other indices, too. To me it looks as if the uptrend is going to stop, probably Monday.
The gap is called an exhaustion gap and it comes at the end of a move. Here's what I write on the website: "Happens at the end of a trend on high volume. The gap is usually not followed by new highs or lows, and the gap may be unusually tall. After the gap, price consolidates or reverses direction. Commonly occurs after continuation gaps. Exhaustion gaps usually close within a week.
Although we won't know for sure if it's an exhaustion gap yet, I think it's likely.
The Dow industrials already shows a continuation gap. This could be another continuation gap but more likely it's an exhaustion gap.
What are the implications of that? Look for a quick reversal. "Violent reversals can follow an exhaustion gap..." Again, that's from the above link. I see price dropping back to A before a recovery.
![]()
The following is a brief review of how the markets performed over time. The numbers refer to the close-to-close move in the Dow industrials.
No options expire this week.
![]()
The following is based on an SFO article in December 2004 by John Seekinger, titled, "Take a two-dimensional approach." He offers these tips.
| Index | S2 | S1 | Pivot | R1 | R2 |
| Dow Industrials (^DJI): Daily | 33,840 | 33,951 | 34,057 | 34,168 | 34,274 |
| Weekly | 31,961 | 33,011 | 33,587 | 34,637 | 35,214 |
| Monthly | 31,681 | 32,871 | 33,517 | 34,708 | 35,354 |
| S&P500 (^GSPC): Daily | 4,316 | 4,337 | 4,355 | 4,377 | 4,395 |
| Weekly | 4,048 | 4,203 | 4,288 | 4,444 | 4,529 |
| Monthly | 3,995 | 4,177 | 4,285 | 4,467 | 4,575 |
| Nasdaq (^IXIC): Daily | 13,272 | 13,375 | 13,448 | 13,551 | 13,623 |
| Weekly | 12,401 | 12,940 | 13,230 | 13,769 | 14,059 |
| Monthly | 12,075 | 12,777 | 13,245 | 13,947 | 14,416 |
Here are the formulas:
![]()
Earnings season is either underway or should be starting soon. The sessions could be more volatile.
Mutual funds will begin dividend distributions and rebalancing their portfolios for the approaching year end (starts in late November).
Here's a symbol list of 291 chart and candlestick patterns (13 "investment grade" candle patterns) found in today's securities using my version of Patternz: DDD, MMM, ANF, ABM, ACN, AYI, ADTN, AES, AFL, APD, AKAM, AEE, AEO, AXP, AMWD, APH, ANIK, ATR, ARCB, AWI, AVY, AVA, AZTA, BCPC, BSET, BECN, BZH, BERY, BIO, BIIB, BKH, BA, BAH, BRC, BCO, BLDR, CE, CF, CRL, CIEN, CLNE, CLF, CNO, CNX, CAG, CSGP, COTY, CTS, DDS, DFS, DSGR, ^DJU, ^DJT, ^DJI, DOV, DRQ, BOOM, EMN, ECL, EME, EMR, WIRE, EFX, EVRG, EZPW, FICO, FIS, FISV, FLEX, FLS, FTNT, IT, GNW, GILD, GMS, GS, GGG, GFF, GES, HBI, HE, HAYN, HON, DHI, HWM, HUM, ILMN, IBP, PODD, ITGR, TILE, IPG, IRM, JBLU, KBH, KMT, KMB, KLAC, KSS, LHX, LZB, LH, LDOS, LEN, RAMP, LPLA, MHO, M, MAN, MCHX, MAS, MA, MTRN, MDC, MDT, MU, MLKN, MCO, MS, MLI, ^IXIC, NTGR, NJR, NXGN, NUS, OGE, OMCL, OMC, OUT, OMI, OXM, PKG, PDCO, PCTY, PRFT, PNW, POR, PPG, PINC, PGR, PHM, PSTG, QTWO, DGX, RJF, RGS, ROL, ROP, ROST, ^GSPC, SBH, SCHW, SEIC, SIGI, SRE, SHW, SLGN, STR, SKYW, SWX, SWN, SR, SCS, TGT, TPX, TER, TXN, TXT, TTD, TKR, TJX, TOL, TDG, TZOO, TREX, UHAL, UGI, V, WU, WLK, WEX, WMB, WWD, ZBRA, ITA, IYM, IAI, IYK, IYC, ITB, IHE, IDU, DDM, FXL, FXI, BOTZ, QQQ, ICF, IYH, IAT, IYZ, IEV, MXI, ILF, SOXX, SLV, IYF, IHI, EWA, EWO, EWK, EWC, ECH, EEM, EWQ, EWG, EWH, EIS, EWI, EWJ, EWM, EWW, EPP, EWS, EZA, EWY, EWP, EWD, EWL, EWT, THD, EWU, QLD, IBB, PPA, DBA, PBE, PEJ, PJP, PHO, SSO, ROBO, XLY, XLF, GLD, XLV, XHB, XLI, XLB, XRT, SPY, XAR, XLU, SMH, VHT, VIS, VAW, MGK, VONG. Click this link for details (pattern type, start and end dates).
For a list of small patterns (those a few days wide) click this link.
The below industries were the best (rank 1) or worst performing of those I follow.
|
-- Thomas Bulkowski
![]()
$ $ $
Here's a symbol list of 242 chart and candlestick patterns (13 "investment grade" candle patterns) found in today's securities using my version of Patternz: DDD, ANF, AYI, ADBE, AEIS, AES, AKAM, ALK, ALGT, AYX, AEE, AEP, AXP, AIG, APH, ANIK, AMAT, ATR, ARCB, AWI, ARW, BCPC, BSET, BECN, BZH, BERY, BKH, BKNG, BRC, BRKR, CLS, CX, COR, CDAY, CHS, CHD, CINF, CLNE, CLF, CROX, CCRN, CTS, XRAY, DFS, DSGR, ^DJT, ^DJI, EXP, EME, WIRE, EQT, EL, EVRG, EXPI, EZPW, FDS, FARO, FIS, FLEX, FWRD, GPS, GIS, GNW, GILD, GPN, GMS, GOOGL, GGG, GFF, HBI, HAYN, HQY, HP, HSIC, HNI, HD, DHI, HOV, HWM, HUM, HURC, IEX, IBP, ITGR, ISRG, IRM, JNJ, KBH, KELYA, KEYS, KLAC, KSS, LHX, LANC, LEN, LNC, LMT, LOW, MHO, MANH, MCHX, MAS, MDC, MGEE, MCO, MLI, ^IXIC, NTAP, NJR, NEWR, NEU, NEE, NXGN, NWPX, NUS, OMCL, ASGN, ON, OR, OUT, PKG, PATK, PYPL, PEN, PLXS, PG, PHM, QTWO, KWR, RNG, ROK, ROL, RES, R, ^GSPC, CRM, SBH, SEE, SRE, SCI, NOW, STR, SKYW, SWN, SPSC, SXI, SCS, TPR, TDY, TFX, TXN, TTD, TOL, TDG, TREX, SLCA, UIS, UNM, VEEV, VRSN, V, WAT, WSO, WLK, WEX, WMB, WSC, WWD, ITA, IAI, IYC, ITB, DDM, FTEC, FDN, QTEC, FXL, BOTZ, QQQ, ICF, IYH, IAT, IYZ, IEV, IGV, IXN, ILF, IYF, IHI, EWA, EWO, EWK, EWZ, EWQ, EWG, EWH, EIS, EWI, EWJ, EWW, EPP, EWY, EWP, EWL, EWT, QLD, PPA, DBA, PBE, PEJ, PHO, SSO, XLY, XLF, XHB, XLI, SPY, XAR, XLK, VIS, MGK, VONG. Click this link for details (pattern type, start and end dates).
For a list of small patterns (those a few days wide) click this link.
$ $ $
You can find setups based on a Fibonacci retrace by clicking on the link.
The following patterns were found manually, not using Patternz. Mr. Bulkowski has excluded any securities he owns from appearing in the list. However, he may add any of the securities listed to his portfolio at any time, just as you can.
In the table below, the red and green colors are based on the historical breakout direction for the associated chart pattern. If a high and tight flag appears, the start and end dates highlight the flagpole only and not the flag.
For details about the chart patterns, click here.
-- Thomas Bulkowski
![]()
| Symbol | Chart Pattern | Bullish Bearish | Start | End | Industry |
| MMM | Head-and-shoulders bottom | 10/06/2023 | 10/27/2023 | Diversified Co. | |
| ADBE | Pipe top | 10/09/2023 | 10/16/2023 | Computer Software and Svcs | |
| ALRM | Double Top, Adam and Eve | 08/11/2023 | 09/25/2023 | Computer Software and Svcs | |
| AEO | Triangle, ascending | 10/12/2023 | 11/02/2023 | Apparel | |
| AXP | Double Bottom, Adam and Adam | 10/23/2023 | 10/27/2023 | Financial Services | |
| AIG | Three Rising Valleys | 08/22/2023 | 10/23/2023 | Insurance (Prop/Casualty) | |
| AR | Ugly double bottom | 10/04/2023 | 10/26/2023 | Natural Gas (Diversified) | |
| ARCB | Pipe bottom | 10/16/2023 | 10/23/2023 | Trucking/Transp. Leasing | |
| AVA | Double Bottom, Eve and Eve | 10/03/2023 | 10/23/2023 | Electric Utility (West) | |
| AXS | Head-and-shoulders top | 09/20/2023 | 11/02/2023 | Insurance (Prop/Casualty) | |
| BSET | Ugly double bottom | 09/29/2023 | 10/16/2023 | Furn/Home Furnishings | |
| CX | Triangle, symmetrical | 09/29/2023 | 11/01/2023 | Cement and Aggregates | |
| CF | Triple top | 09/26/2023 | 10/10/2023 | Chemical (Basic) | |
| CLF | Pipe bottom | 10/16/2023 | 10/23/2023 | Metals and Mining (Div.) | |
| CCRN | Dead-cat bounce | 11/02/2023 | 11/02/2023 | Human Resources | |
| WIRE | Head-and-shoulders top | 09/29/2023 | 10/17/2023 | Metals and Mining (Div.) | |
| EL | Dead-cat bounce | 11/01/2023 | 11/01/2023 | Toiletries/Cosmetics | |
| EXC | Ugly double bottom | 10/03/2023 | 10/23/2023 | Electric Utility (East) | |
| FE | Ugly double bottom | 10/03/2023 | 10/23/2023 | Electric Utility (East) | |
| GIS | Ugly double bottom | 10/06/2023 | 10/30/2023 | Food Processing | |
| HQY | Double Top, Adam and Eve | 09/28/2023 | 10/13/2023 | Healthcare Information | |
| IDA | Head-and-shoulders complex bottom | 08/21/2023 | 10/31/2023 | Electric Utility (West) | |
| ITGR | Pipe bottom | 10/16/2023 | 10/23/2023 | Electronics | |
| TILE | Head-and-shoulders complex top | 09/14/2023 | 10/05/2023 | Furn/Home Furnishings | |
| KLIC | Double Bottom, Adam and Adam | 10/25/2023 | 11/01/2023 | Semiconductor Cap Equip. | |
| LDOS | Head-and-shoulders bottom | 09/26/2023 | 10/27/2023 | IT Services | |
| LLY | Pipe top | 10/09/2023 | 10/16/2023 | Drug | |
| LMT | Ugly double bottom | 10/06/2023 | 10/27/2023 | Aerospace/Defense | |
| MHO | Pipe bottom | 10/16/2023 | 10/23/2023 | Homebuilding | |
| MGEE | Ugly double bottom | 10/03/2023 | 10/25/2023 | Electric Utility (Central) | |
| OMC | Triangle, symmetrical | 10/04/2023 | 11/01/2023 | Advertising | |
| ON | Dead-cat bounce | 10/30/2023 | 10/30/2023 | Semiconductor | |
| PANW | Pipe top | 10/09/2023 | 10/16/2023 | Computer Software and Svcs | |
| PKE | Triangle, symmetrical | 10/06/2023 | 10/31/2023 | Chemical (Specialty) | |
| PATK | Triple bottom | 10/09/2023 | 10/26/2023 | Retail Building Supply | |
| PETS | Dead-cat bounce | 10/31/2023 | 10/31/2023 | Medical Services | |
| PCG | Pipe bottom | 10/02/2023 | 10/09/2023 | Electric Utility (West) | |
| PEG | Ugly double bottom | 10/03/2023 | 10/23/2023 | Electric Utility (East) | |
| SBH | Pipe bottom | 10/09/2023 | 10/16/2023 | Toiletries/Cosmetics | |
| SIGI | Diamond top | 09/25/2023 | 11/01/2023 | Insurance (Prop/Casualty) | |
| SRE | Ugly double bottom | 10/03/2023 | 10/23/2023 | Electric Utility (West) | |
| SHW | Double Bottom, Adam and Adam | 10/24/2023 | 10/30/2023 | Chemical (Basic) | |
| TRGP | Ugly double bottom | 10/05/2023 | 10/30/2023 | Natural Gas (Diversified) | |
| TEVA | Double Bottom, Adam and Adam | 10/23/2023 | 10/27/2023 | Drug | |
| V | Triple bottom | 09/27/2023 | 10/27/2023 | Financial Services | |
| WRB | Three Rising Valleys | 08/23/2023 | 10/23/2023 | Insurance (Prop/Casualty) | |
| WPM | Diamond top | 10/17/2023 | 11/02/2023 | Metals and Mining (Div.) | |
| FDN | Triple top | 07/19/2023 | 09/11/2023 | Internet | |
| SOXX | Head-and-shoulders complex top | 06/14/2023 | 09/05/2023 | Semiconductor |
![]()
Since I post this the night before, check how the futures are trading before market open. Large moves can affect the opening direction.
$ $ $
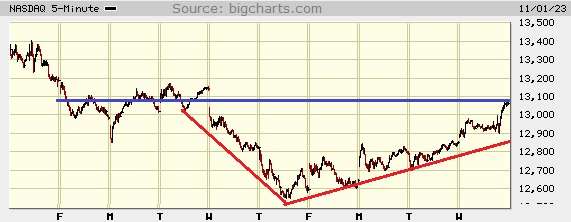
I show a picture of the Nasdaq composite on the 5-minute scale.
The red lines show a V-bottom. Notice that it took price 1.5 days to drop and 4.5 days to recover and it hasn't quite made it back to where it started from, at about 13,150 (Tuesday's close).
It's no surprise that price drops twice as fast (or more) than it rises.
The blue line is overhead resistance. We might see one more day of rising prices but after that, I think we'll see a pause to mirror what we see on the left part of the V (where the blue line is).
$ $ $
Here's a symbol list of 142 chart and candlestick patterns (13 "investment grade" candle patterns) found in today's securities using my version of Patternz: DDD, ACN, AYI, ADBE, AEIS, AA, ALGT, AYX, AMZN, AEO, AEP, AME, APH, ARCB, ADM, AGO, ADP, AVA, BALL, BZH, BERY, BIG, BA, BAH, BRC, BFH, BMY, CDNS, CALM, CE, CHKP, CLF, CMTL, COP, CRH, CTS, DSGR, EME, WIRE, EOG, EL, EVRG, EZPW, FLEX, FMC, FTNT, FDP, GIS, GNW, GILD, GL, GGG, HBI, HQY, HP, HOV, HUN, HURC, IDA, IEX, ITW, INCY, IIIN, ITGR, TILE, JKHY, KALU, KMT, LANC, LDOS, RAMP, LPLA, MHO, MRO, MCHX, MLM, MTRN, MTRX, META, MGEE, MU, MSFT, ^IXIC, NOV, NFLX, NWL, NEE, NOC, NUS, OXY, OMC, ORCL, OXM, PKG, PTEN, PAYX, PXD, REGN, RGS, RGA, ROK, ROL, ^GSPC, SCI, SHOP, STR, SKYW, SSYS, TDY, TKR, SLCA, VFC, VRSN, WSO, WEX, WMB, WWW, FTEC, QQQ, IYZ, IXN, ILF, SOXX, EWQ, EIS, EWJ, QLD, IBB, PXJ, SSO, ROBO, XLE, SPY, XLK, SMH, MGK, VONG. Click this link for details (pattern type, start and end dates).
For a list of small patterns (those a few days wide) click this link.
$ $ $
The following table shows where Fibonacci retrace values of the day's high-low range are plus pivot points, calculated on the Nasdaq composite, sorted by value. When several are near each other (small differences), the area might act as support or resistance.
-- Thomas Bulkowski
![]()
| © 2023 ThePatternSite.com Metric | Value | Diff | Close (within 10% of the high-low range for the day)? |
| Monthly S2 | 11,936.21 | ||
| Weekly S2 | 12,298.71 | 362.50 | |
| Monthly S1 | 12,498.84 | 200.13 | |
| Weekly S1 | 12,680.09 | 181.25 | |
| Daily S2 | 12,805.81 | 125.72 | |
| Low | 12,875.20 | 69.39 | |
| Open | 12,887.06 | 11.86 | Yes! The Open is close to the Low. |
| Weekly Pivot | 12,925.24 | 38.18 | |
| Daily S1 | 12,933.64 | 8.40 | Yes! The Daily S1 is close to the Weekly Pivot. |
| 61.8% Down from Intraday High | 12,950.54 | 16.90 | Yes! The 61.8% Down from Intraday High is close to the Daily S1. |
| 50% Down from Intraday High | 12,973.81 | 23.27 | |
| 38.2% Down from Intraday High | 12,997.08 | 23.27 | |
| Daily Pivot | 13,003.03 | 5.95 | Yes! The Daily Pivot is close to the 38.2% Down from Intraday High. |
| Close | 13,061.47 | 58.44 | |
| High | 13,072.42 | 10.95 | Yes! The High is close to the Close. |
| Monthly Pivot | 13,106.49 | 34.07 | |
| Daily R1 | 13,130.86 | 24.37 | |
| Daily R2 | 13,200.25 | 69.39 | |
| Weekly R1 | 13,306.62 | 106.37 | |
| Weekly R2 | 13,551.77 | 245.15 | |
| Monthly R1 | 13,669.12 | 117.35 | |
| Monthly R2 | 14,276.77 | 607.65 |
Here's the updated 2023 forecast, presented in slider format.
$ $ $
I released new research about detecting a large drop after price peaks. See Monthly candles
$ $ $
Here's a symbol list of 69 chart and candlestick patterns (13 "investment grade" candle patterns) found in today's securities using my version of Patternz: A, ALGT, ALL, AEO, AEL, AFG, AMGN, ARCB, AGO, AVA, BSET, BECN, BZH, BERY, BA, BRC, BG, CNP, CLF, CMTL, DHR, DSGR, EME, WIRE, EXPI, FICO, FLEX, FMC, FWRD, GGG, HBI, HLIT, HQY, ITGR, IPI, NVTA, JBLU, K, KFRC, KSS, MHO, MCHX, NEU, NEE, NXGN, JWN, OMC, ON, PKG, PTEN, PETS, PFE, ROL, SKYW, SCS, SSYS, SLCA, IEZ, FXL, IHI, EWK, EWJ, PHO, ROBO. Click this link for details (pattern type, start and end dates).
For a list of small patterns (those a few days wide) click this link.
-- Thomas Bulkowski
![]()
Support this site! Clicking any of the books (below) takes you to
Amazon.com If you buy ANYTHING while there, they pay for the referral.
Legal notice for paid links: "As an Amazon Associate I earn from qualifying purchases."
|
My Stock Market Books
|
My Novels
Orb Foresight Rewrite Coming!
|