
As of 05/04/2026
Indus: 48,942 -557.37 -1.1%
Trans: 19,606 -992.51 -4.8%
Utils: 1,153 -4.13 -0.4%
Nasdaq: 25,068 -46.64 -0.2%
S&P 500: 7,201 -29.37 -0.4%
|
YTD
+1.8%
+13.0%
+7.9%
+7.9%
+5.2%
|
|
As of 05/04/2026
Indus: 48,942 -557.37 -1.1%
Trans: 19,606 -992.51 -4.8%
Utils: 1,153 -4.13 -0.4%
Nasdaq: 25,068 -46.64 -0.2%
S&P 500: 7,201 -29.37 -0.4%
|
YTD
+1.8%
+13.0%
+7.9%
+7.9%
+5.2%
| |
|
| ||
$ $ $
Here's a symbol list of 125 chart and candlestick patterns (13 "investment grade" candle patterns) found in today's securities using my version of Patternz: AXDX, ADTN, AES, A, ALL, AEL, AXP, AIG, AMGN, BSET, BZH, BERY, BIIB, BMRN, BKH, BLDR, CAL, COR, CNC, CENX, CNA, CNX, CMTL, CXW, COTY, CCRN, ^DJT, DTE, EXP, EMR, EFX, FAST, FDX, FIS, FIVN, FMC, GD, GFS, THG, HE, HNI, JBHT, HUN, HURC, IDA, IDXX, PODD, ITGR, INTC, IBKR, IPI, JBLU, KMT, KMB, LHX, LH, LDOS, LXU, M, MRO, MKTX, MTRX, MRK, META, MU, MLKN, MOS, NFG, NFLX, NWPX, OXY, OGE, ORI, OTEX, OUT, PKG, PFE, PXD, PEG, RGS, RGA, RLI, ROK, SBH, SEIC, SRE, SMTC, SLGN, STR, SKX, SNPS, TFX, TSCO, TRV, UPS, VECO, MDRX, WSO, ZBRA, IYM, IDU, DDM, IYH, IGV, IXC, MXI, EEM, EWH, EIS, EWJ, EWM, EPP, EWS, EWY, EWT, TUR, ROBO, XLY, XLE, XLU, UNG. Click this link for details (pattern type, start and end dates).
For a list of small patterns (those a few days wide) click this link.
$ $ $
You can find setups based on a Fibonacci retrace by clicking on the link.
The following patterns were found manually, not using Patternz. Mr. Bulkowski has excluded any securities he owns from appearing in the list. However, he may add any of the securities listed to his portfolio at any time, just as you can.
In the table below, the red and green colors are based on the historical breakout direction for the associated chart pattern. If a high and tight flag appears, the start and end dates highlight the flagpole only and not the flag.
For details about the chart patterns, click here.
-- Thomas Bulkowski
![]()
| Symbol | Chart Pattern | Bullish Bearish | Start | End | Industry |
| AXP | Cup with handle | 07/19/2023 | 12/04/2023 | Financial Services | |
| APA | Pipe bottom | 12/04/2023 | 12/11/2023 | Petroleum (Producing) | |
| ADM | Broadening top | 11/15/2023 | 12/04/2023 | Food Processing | |
| CLF | Pennant | 12/20/2023 | 12/28/2023 | Metals and Mining (Div.) | |
| CLX | Diamond top | 11/28/2023 | 12/28/2023 | Household Products | |
| COP | Triple bottom | 11/16/2023 | 12/12/2023 | Petroleum (Integrated) | |
| CXW | Pipe bottom | 12/04/2023 | 12/11/2023 | Industrial Services | |
| DRQ | Pipe bottom | 12/04/2023 | 12/11/2023 | Oilfield Svcs/Equipment | |
| EFX | Cup with handle | 07/17/2023 | 12/18/2023 | Information Services | |
| FISV | Pennant | 12/15/2023 | 12/27/2023 | IT Services | |
| GFS | Head-and-shoulders bottom | 08/25/2023 | 12/06/2023 | Semiconductor | |
| GOOGL | Triangle, symmetrical | 10/12/2023 | 12/19/2023 | Internet | |
| NSP | Diamond top | 12/04/2023 | 12/27/2023 | Human Resources | |
| KFRC | Triangle, descending | 12/01/2023 | 12/28/2023 | Human Resources | |
| LHX | Head-and-shoulders bottom | 09/08/2023 | 10/27/2023 | Aerospace/Defense | |
| MGY | Pipe bottom | 12/04/2023 | 12/11/2023 | Petroleum (Producing) | |
| MTDR | Pipe bottom | 12/04/2023 | 12/11/2023 | Petroleum (Producing) | |
| MUR | Pipe bottom | 12/04/2023 | 12/11/2023 | Petroleum (Integrated) | |
| NTAP | Triangle, symmetrical | 11/29/2023 | 12/26/2023 | Computers and Peripherals | |
| NJR | Triangle, symmetrical | 12/12/2023 | 12/28/2023 | Natural Gas (Distributor) | |
| ORI | Triangle, descending | 11/29/2023 | 12/27/2023 | Insurance (Prop/Casualty) | |
| OMI | Double Top, Eve and Adam | 12/06/2023 | 12/14/2023 | Medical Supplies | |
| RGS | Flag, high and tight | 12/20/2023 | 12/28/2023 | Toiletries/Cosmetics | |
| ROK | Cup with handle | 10/12/2023 | 12/15/2023 | Diversified Co. | |
| SBH | Cup with handle | 07/26/2023 | 12/14/2023 | Toiletries/Cosmetics | |
| SLB | Pipe bottom | 12/04/2023 | 12/11/2023 | Oilfield Svcs/Equipment | |
| STR | Pipe bottom | 12/04/2023 | 12/11/2023 | Natural Gas (Diversified) | |
| SWN | Pipe bottom | 12/04/2023 | 12/11/2023 | Natural Gas (Diversified) | |
| SCS | Flag | 12/21/2023 | 12/28/2023 | Furn/Home Furnishings | |
| SNPS | Double Top, Adam and Eve | 11/30/2023 | 12/13/2023 | Computer Software and Svcs | |
| TFX | Cup with handle | 07/24/2023 | 12/18/2023 | Diversified Co. | |
| RIG | Pipe bottom | 12/04/2023 | 12/11/2023 | Oilfield Svcs/Equipment | |
| WDAY | Triple bottom | 09/28/2023 | 10/27/2023 | Computer Software and Svcs |
![]()
Since I post this the night before, check how the futures are trading before market open. Large moves can affect the opening direction.
$ $ $
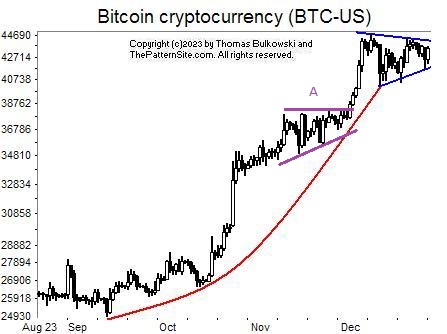
I show a picture of the cryptocurrency BTC-USD on the daily scale.
I read a headline that cryptocurrencies were back in vogue. Is that true?
The chart says, "Yes."
The red line shows momentum increasing when the trendline bends upward in an exponential rise. I don't know if that's true or not but the steep rise says it can't last much longer. Maybe that's why we see a symmetrical triangle forming in blue. That gives the rise a pause, a chance to catch its breath.
If the pattern breaks out upward (closes above the top blue trendline), then look for the upward move to resume. A downward breakout might be fake and you'll see the currency recover and shoot upward. Of course, a downward breakout could be real, too. That might send the coin back down to 38,000 or so (that's the level of the top of an ascending triangle, A, in mid November).
$ $ $
Here's a symbol list of 98 chart and candlestick patterns (13 "investment grade" candle patterns) found in today's securities using my version of Patternz: AYI, AFL, ALB, AXP, ANIK, AR, ARW, AGO, ATO, BSET, BIO, BKNG, BOOT, BRC, CNX, CGNX, CMTL, CXW, DSGR, ^DJT, EXP, EBAY, ELV, EFX, FIS, FIVN, FNV, HL, HSII, HNI, HUBG, HUN, NSP, INTC, IPI, INTU, KALU, KMT, LHX, LH, LLY, LXU, MHO, MRCY, META, MU, MLKN, NFG, NWL, NEE, OXY, OMCL, PRFT, PETS, PFE, PINC, DGX, RMBS, RGS, RLI, ROK, SBH, SAIC, SEE, SMTC, SNPS, TFX, TXN, UPS, VECO, WMT, WERN, ZBRA, IAI, IAT, IXC, MXI, SLV, EWO, EWK, EWC, EEM, EWS, EWY, EWT, TUR, PJP, XLE, UNG, SMH. Click this link for details (pattern type, start and end dates).
For a list of small patterns (those a few days wide) click this link.
$ $ $
The following table shows where Fibonacci retrace values of the day's high-low range are plus pivot points, calculated on the Nasdaq composite, sorted by value. When several are near each other (small differences), the area might act as support or resistance.
-- Thomas Bulkowski
![]()
| © 2023 ThePatternSite.com Metric | Value | Diff | Close (within 10% of the high-low range for the day)? |
| Monthly S2 | 13,731.56 | ||
| Monthly S1 | 14,415.37 | 683.81 | |
| Weekly S2 | 14,688.59 | 273.22 | |
| Monthly Pivot | 14,742.33 | 53.74 | |
| Weekly S1 | 14,893.88 | 151.55 | |
| Weekly Pivot | 14,981.59 | 87.70 | |
| Daily S2 | 15,025.90 | 44.31 | |
| Low | 15,051.67 | 25.77 | |
| Daily S1 | 15,062.54 | 10.87 | |
| 61.8% Down from Intraday High | 15,075.51 | 12.97 | |
| 50% Down from Intraday High | 15,082.88 | 7.36 | |
| Daily Pivot | 15,088.31 | 5.43 | Yes! The Daily Pivot is close to the 50% Down from Intraday High. |
| Open | 15,089.66 | 1.35 | Yes! The Open is close to the Daily Pivot. |
| 38.2% Down from Intraday High | 15,090.24 | 0.58 | Yes! The 38.2% Down from Intraday High is close to the Open. |
| Close | 15,099.18 | 8.94 | |
| High | 15,114.08 | 14.90 | |
| Daily R1 | 15,124.95 | 10.87 | |
| Daily R2 | 15,150.72 | 25.77 | |
| Weekly R1 | 15,186.88 | 36.16 | |
| Weekly R2 | 15,274.59 | 87.70 | |
| Monthly R1 | 15,426.14 | 151.55 | |
| Monthly R2 | 15,753.10 | 326.96 |
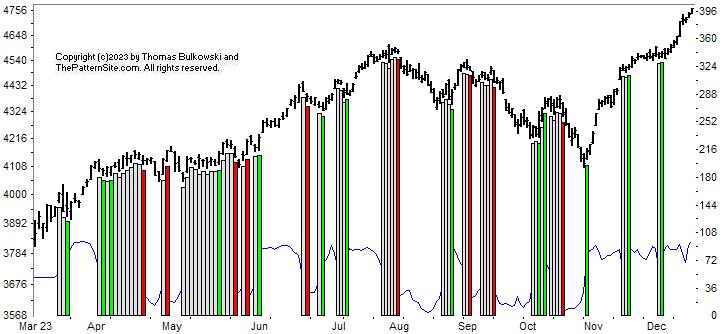
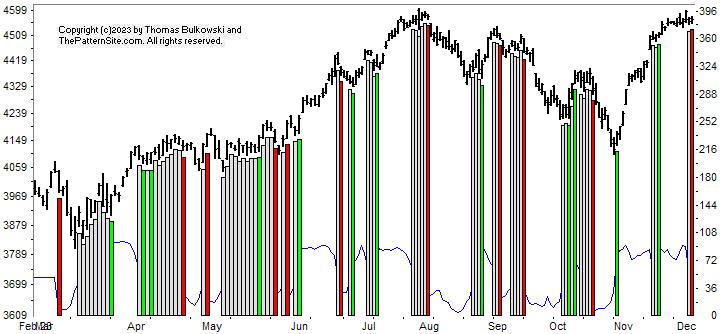
This is a picture of the chart pattern indicator on the daily scale. The indicator is the line chart below a chart of the S&P 500 composite.
The CPI has a bullish reading of 91.1, which is near the top of the scale (100). Maybe the index is trying for a Fibonacci extension.
That's like the opposite of a retrace. My research says that Fib extensions are no more likely to be reached than any other number. So forget Fibs.
I'm still waiting for a retrace to begin. I thought one started about a week ago, but I was mistaken. So the uptrend will continue until it ends.
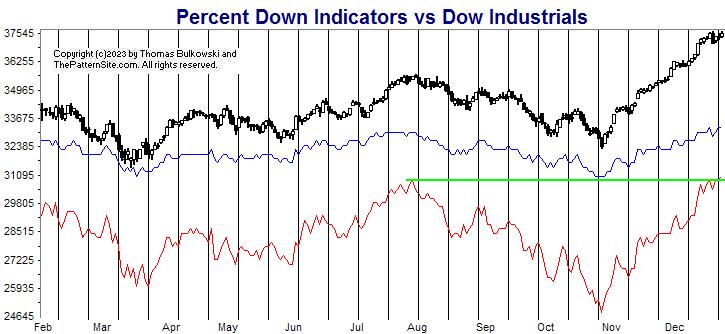
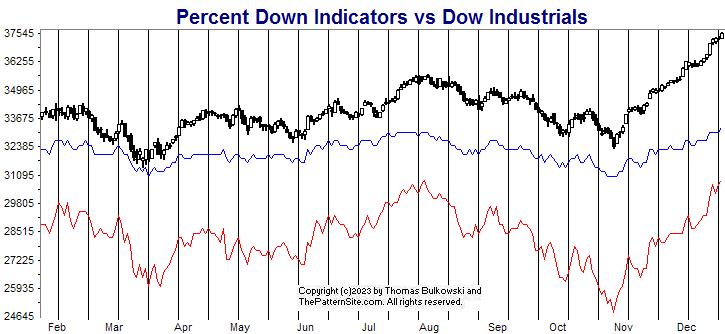
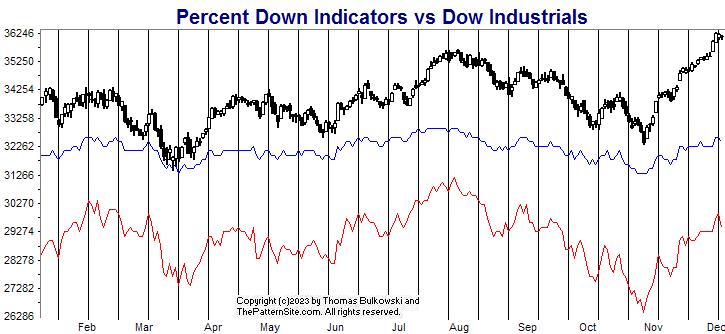
The red line is the percentage of stocks at least 20% below their 1-year high (plotted upside down). The blue line is the average percentage drop of stocks below their 1-year high (plotted upside down).
On Tuesday, 25% of stocks in my database are in bear market territory (down at least 20% from their 1-year high).A week ago, it was 27%.The fewest was 25% on 12/26/2023.And the most was 57% on 12/28/2022.
The 518 stocks in my database are down an average of 13% from their yearly high.A week ago, the average was 15%.The peak was 13% on 12/26/2023.And the bottom was 26% on 12/28/2022.
Both lines show improvement this week compared to last week.
I drew a horizontal green line not because it's Christmas, but because the color is different from the others used. Is shows the height of the prior peak compared to today's peak. We're currently a nubbin's worth above the line.
Both charts are bullish but be warned. A retrace is coming.
$ $ $
Here's a symbol list of 95 chart and candlestick patterns (13 "investment grade" candle patterns) found in today's securities using my version of Patternz: ADTN, A, ALRM, AYX, DOX, AXP, ANIK, AR, APA, ADSK, AXS, BA, BSX, BRC, BG, CENX, CNO, CMCO, GLW, CRH, CROX, CCK, DFS, EXP, EBAY, EFX, FIS, FIVN, FORM, FTNT, HAYN, HSIC, JBHT, IEX, INTC, NVTA, KFRC, KLAC, LHX, LEG, LMT, MGEE, MS, NFG, NTAP, NWL, NKE, NUS, OMCL, PCG, PINC, PFG, RHI, ROK, SAIA, SBH, SLB, SMG, SEE, SCI, STR, SMAR, LUV, SPSC, SXI, SSYS, SNPS, TFX, TER, TJX, RIG, TRV, TWLO, UIS, WSC, ZBRA, IEZ, QTEC, ILF, IYF, IHI, EWO, EWZ, EWM, EWD, EWT, TUR, IBB, PEJ, USO, SMH. Click this link for details (pattern type, start and end dates).
For a list of small patterns (those a few days wide) click this link.
-- Thomas Bulkowski
![]()
$ $ $
I show another slider trading quiz featuring Perficient: PRFT.
$ $ $
Here's a symbol list of 168 chart and candlestick patterns (13 "investment grade" candle patterns) found in today's securities using my version of Patternz: MMM, APD, ALRM, ALK, AA, ALKS, AXP, AMGN, AMN, APH, ANIK, AR, APA, ARCB, ARW, AVY, AVNT, AVA, BCPC, BAX, BIIB, BRC, BMY, CBT, CDNS, CE, CLS, COR, CENX, CDAY, CMTL, CONN, COP, CXW, CROX, CW, ^DJT, DRQ, DTE, EXP, EMN, EFX, EQT, EG, EZPW, FE, FIVN, FTNT, FNV, FDP, GNW, GOOGL, GES, HLIT, HAYN, HTLD, HP, ITW, INTC, NVTA, KALU, KFRC, LHX, LH, LRCX, LEG, LLY, LNC, MGY, MAN, MRO, MCHX, MRTN, MTDR, MTRX, MRK, META, MLKN, MS, MUR, NBR, NTAP, NJR, NUS, OXY, OR, PTEN, PCTY, PETS, PXD, PINC, QCOM, RGS, RHI, ROK, ROG, RES, R, SAIA, SBH, SAND, SLB, NOW, STR, SKYW, SCCO, LUV, SWN, SXI, SNPS, TFX, TEVA, TXT, RIG, TZOO, UHAL, UGI, VECO, WMT, WPM, ZBRA, IYM, IAI, IYE, IEZ, IHE, IYH, IXC, MXI, SLV, IGE, IEO, EWC, EWJ, EWD, THD, IBB, PPA, PBE, PXJ, PJP, PHO, ROBO, XLE, GLD, XLV, XLI, XLB, XAR, USO, VHT, VIS, VAW. Click this link for details (pattern type, start and end dates).
For a list of small patterns (those a few days wide) click this link.
$ $ $
The following table shows where Fibonacci retrace values of the day's high-low range are plus pivot points, calculated on the Dow industrials, sorted by value. When several are near each other (small differences), the area might act as support or resistance.
-- Thomas Bulkowski
![]()
| © 2023 ThePatternSite.com Metric | Value | Diff | Close (within 10% of the high-low range for the day)? |
| Monthly S2 | 33,911.76 | ||
| Monthly S1 | 35,648.87 | 1,737.11 | |
| Monthly Pivot | 36,645.08 | 996.21 | |
| Weekly S2 | 36,798.51 | 153.43 | |
| Weekly S1 | 37,092.24 | 293.73 | |
| Daily S2 | 37,130.82 | 38.58 | |
| Daily S1 | 37,258.39 | 127.58 | |
| Low | 37,268.88 | 10.48 | Yes! The Low is close to the Daily S1. |
| Open | 37,349.27 | 80.39 | |
| Weekly Pivot | 37,366.77 | 17.50 | Yes! The Weekly Pivot is close to the Open. |
| 61.8% Down from Intraday High | 37,370.36 | 3.59 | Yes! The 61.8% Down from Intraday High is close to the Weekly Pivot. |
| Close | 37,385.97 | 15.61 | Yes! The Close is close to the 61.8% Down from Intraday High. |
| Daily Pivot | 37,396.46 | 10.49 | Yes! The Daily Pivot is close to the Close. |
| 50% Down from Intraday High | 37,401.70 | 5.24 | Yes! The 50% Down from Intraday High is close to the Daily Pivot. |
| 38.2% Down from Intraday High | 37,433.05 | 31.35 | |
| Daily R1 | 37,524.04 | 90.99 | |
| High | 37,534.52 | 10.48 | Yes! The High is close to the Daily R1. |
| Weekly R1 | 37,660.50 | 125.98 | |
| Daily R2 | 37,662.10 | 1.60 | Yes! The Daily R2 is close to the Weekly R1. |
| Weekly R2 | 37,935.03 | 272.93 | |
| Monthly R1 | 38,382.19 | 447.16 | |
| Monthly R2 | 39,378.40 | 996.21 |
$ $ $
Here's a symbol list of 108 chart and candlestick patterns (13 "investment grade" candle patterns) found in today's securities using my version of Patternz: MMM, AYI, APD, AMN, APH, AR, APA, ARCB, AGO, ADP, BERY, CONN, COP, CXW, DRQ, EXP, EMN, EOG, EFX, EQT, XOM, FDX, FIVN, FORM, FTNT, FCX, GGG, GES, THG, HLIT, HAYN, HOV, HUBG, NVTA, KLAC, LHX, LH, MGY, MRO, MTDR, META, MGEE, MU, MLKN, MS, MUR, NBR, NOV, OXY, ON, OR, PKE, PETS, PXD, PLXS, PEG, RMBS, RGS, RHI, ROK, ROG, RES, SAIA, SBH, SLB, STR, SWN, TFX, TXN, TSCO, RIG, WDAY, ZBRA, IYM, IYE, IEZ, IDU, FXI, IEV, MXI, ILF, SLV, IEO, EWA, EWZ, ECH, EEM, EWQ, EWH, EWI, EWJ, EPP, EWS, EWY, EWP, EWD, EWT, THD, TUR, EWU, PXJ, ROBO, XLE, USO, VAW. Click this link for details (pattern type, start and end dates).
For a list of small patterns (those a few days wide) click this link.
$ $ $
You can find setups based on a Fibonacci retrace by clicking on the link.
The following patterns were found manually, not using Patternz. Mr. Bulkowski has excluded any securities he owns from appearing in the list. However, he may add any of the securities listed to his portfolio at any time, just as you can.
In the table below, the red and green colors are based on the historical breakout direction for the associated chart pattern. If a high and tight flag appears, the start and end dates highlight the flagpole only and not the flag.
For details about the chart patterns, click here.
-- Thomas Bulkowski
![]()
| Symbol | Chart Pattern | Bullish Bearish | Start | End | Industry |
| AMN | Pipe bottom | 11/06/2023 | 11/13/2023 | Human Resources | |
| AON | Double Top, Eve and Adam | 11/13/2023 | 12/13/2023 | Insurance (Diversified) | |
| CENX | Flag, high and tight | 10/27/2023 | 12/21/2023 | Metals and Mining (Div.) | |
| COP | Pipe bottom | 12/04/2023 | 12/11/2023 | Petroleum (Integrated) | |
| DVN | Double Bottom, Adam and Adam | 12/06/2023 | 12/13/2023 | Natural Gas (Diversified) | |
| FANG | Double Bottom, Adam and Adam | 12/06/2023 | 12/12/2023 | Petroleum (Producing) | |
| DRQ | Double Bottom, Adam and Adam | 12/07/2023 | 12/12/2023 | Oilfield Svcs/Equipment | |
| WIRE | Three Rising Valleys | 07/26/2023 | 10/24/2023 | Metals and Mining (Div.) | |
| EXC | Double Top, Adam and Adam | 11/03/2023 | 12/14/2023 | Electric Utility (East) | |
| FIS | Diamond top | 12/05/2023 | 12/21/2023 | Computer Software and Svcs | |
| GE | Broadening top | 08/14/2023 | 11/20/2023 | Diversified Co. | |
| GL | Double Top, Eve and Eve | 12/04/2023 | 12/12/2023 | Insurance (Life) | |
| HLIT | Pipe bottom | 12/04/2023 | 12/11/2023 | Telecom. Equipment | |
| HP | Double Bottom, Adam and Adam | 12/06/2023 | 12/13/2023 | Petroleum (Producing) | |
| HUM | Double Top, Eve and Eve | 10/17/2023 | 11/27/2023 | Medical Services | |
| MGY | Double Bottom, Adam and Adam | 12/06/2023 | 12/12/2023 | Petroleum (Producing) | |
| MTRX | Broadening top, right-angled and descending | 11/20/2023 | 12/19/2023 | Oilfield Svcs/Equipment | |
| MGEE | Triple top | 11/15/2023 | 12/14/2023 | Electric Utility (Central) | |
| MLI | Rounding bottom | 07/24/2023 | 12/15/2023 | Metal Fabricating | |
| ^IXIC | Ugly double bottom | 10/26/2023 | 12/04/2023 | None | |
| OXY | Pipe bottom | 12/04/2023 | 12/11/2023 | Petroleum (Producing) | |
| OR | Three Rising Valleys | 10/03/2023 | 12/12/2023 | Metals and Mining (Div.) | |
| PKE | Triple top | 11/15/2023 | 12/14/2023 | Chemical (Specialty) | |
| PEG | Head-and-shoulders top | 11/03/2023 | 12/14/2023 | Electric Utility (East) | |
| ROK | Rounding bottom | 10/12/2023 | 12/15/2023 | Diversified Co. | |
| ROG | Ugly double bottom | 11/02/2023 | 12/13/2023 | Electronics | |
| SAIA | Ugly double bottom | 10/27/2023 | 11/30/2023 | Trucking/Transp. Leasing | |
| TKR | Cup with handle | 09/01/2023 | 12/14/2023 | Metal Fabricating | |
| TG | Double Top, Eve and Adam | 11/20/2023 | 12/04/2023 | Chemical (Specialty) | |
| WRB | Double Top, Eve and Eve | 12/04/2023 | 12/12/2023 | Insurance (Prop/Casualty) | |
| WEX | Pipe bottom | 10/23/2023 | 10/30/2023 | Information Services |
![]()
Since I post this the night before, check how the futures are trading before market open. Large moves can affect the opening direction.
$ $ $
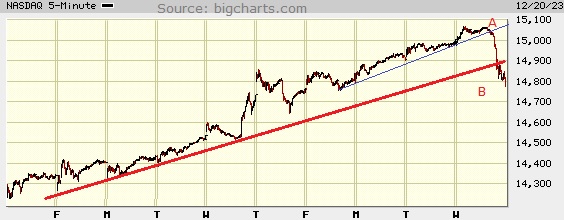
I show a picture of the Nasdaq composite on the 5-minute scale.
This was a surprise drop, at least to me. I wrote yesterday, "I still think a retrace is coming but rather than continue to claim the sky is falling, I'll wait for it to do so before getting cautious."
I believe we are seeing the start of the retrace but I won't know for sure until the index continues lower for a few days (which is my expectation).
As to the chart, trendline B shows that the index crashed through the red line. I drew another line, A. Line A hugs the index better in the later stage of the rise. At B, notice that the drop gets more choppy, like it's trying to recover. So we might see an up move at or near the open on Thursday.
I've been waiting for the market to crest before I sell two stocks with small losses. If others do the same, then yes, the index will continue lower, setting the stage for a significant, and overdue, retrace.
$ $ $
Here's a symbol list of 175 chart and candlestick patterns (13 "investment grade" candle patterns) found in today's securities using my version of Patternz: MMM, ACIW, ADTN, A, ALRM, ALK, AEL, AR, AON, APA, ARCB, ASH, BKH, BKNG, BRKR, CAL, COR, CDAY, CHKP, CI, CNA, CMCO, CAG, CONN, COP, CXW, CSGS, CW, XRAY, DVN, DRQ, BOOM, EXP, EMN, EMR, WIRE, EOG, EFX, EQT, XOM, FIVN, FTNT, FNV, FCX, GNW, GOOGL, GGG, GFF, GES, HLIT, HAYN, HL, HELE, HP, HSIC, HOLX, HURC, IDXX, INCY, IPAR, ISRG, NVTA, IRM, JKHY, JAZZ, JNJ, KSS, LHX, LH, RAMP, LMT, LXU, MGY, MRO, MTDR, MTRX, MRK, META, MGEE, MSFT, MCO, MS, MUR, NBR, NFLX, NTGR, NJR, NWL, NEU, NVDA, OXY, OGE, OR, OUT, PKE, PTEN, PETS, PCG, PXD, PLXS, POR, PEG, DGX, RGS, RHI, ROK, ROG, RGLD, RES, SAIA, SBH, SLB, SIGI, SLGN, STR, SKYW, SMAR, SWN, SR, TECH, TFX, TXT, RIG, TG, SLCA, UIS, V, WPM, WWD, ZBRA, IYE, IEZ, IHE, FXI, BOTZ, IXC, SLV, IEO, EWJ, TUR, PBE, PXJ, PJP, ROBO, XLE, USO, VAW. Click this link for details (pattern type, start and end dates).
For a list of small patterns (those a few days wide) click this link.
$ $ $
The following table shows where Fibonacci retrace values of the day's high-low range are plus pivot points, calculated on the Nasdaq composite, sorted by value. When several are near each other (small differences), the area might act as support or resistance.
-- Thomas Bulkowski
![]()
| © 2023 ThePatternSite.com Metric | Value | Diff | Close (within 10% of the high-low range for the day)? |
| Monthly S2 | 13,272.61 | ||
| Monthly S1 | 14,025.27 | 752.67 | |
| Weekly S2 | 14,121.66 | 96.39 | |
| Monthly Pivot | 14,440.45 | 318.79 | |
| Weekly S1 | 14,449.80 | 9.35 | Yes! The Weekly S1 is close to the Monthly Pivot. |
| Daily S2 | 14,581.51 | 131.71 | |
| Weekly Pivot | 14,652.71 | 71.20 | |
| Daily S1 | 14,679.72 | 27.01 | Yes! The Daily S1 is close to the Weekly Pivot. |
| Low | 14,776.29 | 96.57 | |
| Close | 14,777.94 | 1.65 | Yes! The Close is close to the Low. |
| Daily Pivot | 14,874.51 | 96.57 | |
| 61.8% Down from Intraday High | 14,888.22 | 13.71 | Yes! The 61.8% Down from Intraday High is close to the Daily Pivot. |
| 50% Down from Intraday High | 14,922.79 | 34.57 | |
| 38.2% Down from Intraday High | 14,957.36 | 34.57 | |
| Daily R1 | 14,972.72 | 15.36 | Yes! The Daily R1 is close to the 38.2% Down from Intraday High. |
| Open | 14,973.36 | 0.64 | Yes! The Open is close to the Daily R1. |
| Weekly R1 | 14,980.85 | 7.49 | Yes! The Weekly R1 is close to the Open. |
| High | 15,069.29 | 88.44 | |
| Daily R2 | 15,167.51 | 98.22 | |
| Weekly R2 | 15,183.76 | 16.25 | Yes! The Weekly R2 is close to the Daily R2. |
| Monthly R1 | 15,193.11 | 9.35 | Yes! The Monthly R1 is close to the Weekly R2. |
| Monthly R2 | 15,608.29 | 415.17 |
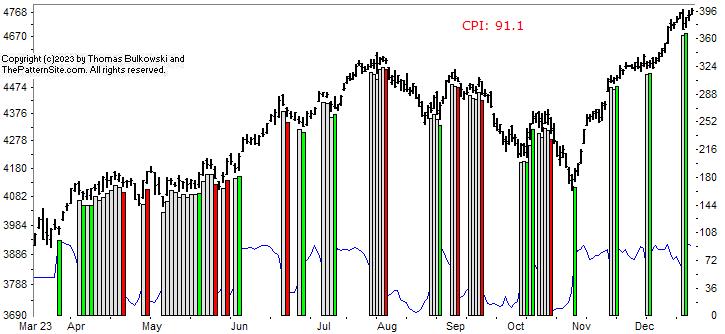
This is a picture of the chart pattern indicator on the daily scale. The indicator is the line chart below a chart of the S&P 500 composite.
After taking a big tumble just days ago (you can see the V-shaped decline in the thin blue line near the bottom of the chart), the CPI has rebounded spectacularly!
It's bullish. There's only one hint of trouble and that is the index hitting the ceiling of 100 and falling. It can move sideways but it usually doesn't do that. It it happens, then it could mean the start of a big retrace.
One thing we know for sure is that the index is going to retrace. When it does, it'll be a buying opportunity if we can time it right.
The red line is the percentage of stocks at least 20% below their 1-year high (plotted upside down). The blue line is the average percentage drop of stocks below their 1-year high (plotted upside down).
On Tuesday, 26% of stocks in my database are in bear market territory (down at least 20% from their 1-year high).A week ago, it was 34%.The fewest was 26% on 12/19/2023.And the most was 57% on 12/28/2022.
The 518 stocks in my database are down an average of 14% from their yearly high.A week ago, the average was 16%.The peak was 14% on 12/19/2023.And the bottom was 26% on 12/28/2022.
Both lines show improvement with the red line making a new high today with 26% of the stocks I follow in bear market territory. The 26% is a low number and it's good news.
The prior chart is bullish and so is this one. I still think a retrace is coming but rather than continue to claim the sky is falling, I'll wait for it to do so before getting cautious. In the meantime, I'm enjoying the ride upward.
$ $ $
Here's a symbol list of 154 chart and candlestick patterns (13 "investment grade" candle patterns) found in today's securities using my version of Patternz: MMM, ANF, AMD, AES, ALK, ALB, DOX, AXP, AR, APA, ATR, ARCB, AGO, AXS, BECN, BOOT, BSX, BCO, BR, BG, CBT, CACI, CAL, CENX, CDAY, CNA, CAG, CONN, COP, CXW, CW, DECK, FANG, DRQ, EXP, EMN, EMR, EFX, EQT, EXPI, XOM, FIVN, FLEX, FLS, FNV, FCX, GNW, GS, GGG, HLIT, HAYN, HTLD, HL, PODD, INTC, NVTA, JKHY, KBH, LHX, LH, MHO, MGY, MRO, MTDR, MTRX, META, MGEE, MS, MLI, MUR, MYGN, NBR, NFLX, NTAP, OXY, OR, PATK, PEN, PETS, PXD, RTX, RGS, RHI, ROK, ROST, RES, SAIA, SBH, SLB, SLGN, STR, SWN, SPSC, TFX, TER, TEVA, TXT, RIG, TRV, TG, VRTX, WEX, ZBRA, ITA, IYM, IYC, IYE, IEZ, IHE, BOTZ, IEV, IXC, MXI, ILF, SLV, IEO, EWA, EWO, EWZ, ECH, EIS, EWI, EWM, EPP, EWS, THD, TUR, EWU, PXJ, ROBO, XLE, XLF, USO, SMH, VHT, VIS, VAW. Click this link for details (pattern type, start and end dates).
For a list of small patterns (those a few days wide) click this link.
-- Thomas Bulkowski
![]()
$ $ $
I show another slider trading quiz featuring broadening formation, right angled and descending.
$ $ $
Here's a symbol list of 148 chart and candlestick patterns (13 "investment grade" candle patterns) found in today's securities using my version of Patternz: MMM, ALRM, ALK, AEE, AMN, ARW, AVNT, BAX, BERY, BIG, BFH, BCO, BR, CE, CNP, CF, CRL, CHKP, CIEN, CLF, CNX, ED, CXW, CCRN, CSGS, CTS, XRAY, DVN, FANG, ^DJU, DTE, EXP, EMN, WIRE, EOG, EFX, EL, EVRG, EXPI, XOM, FE, FIVN, FLEX, FCX, FRD, GME, GPS, GNW, GS, GPRO, GGG, HE, HAYN, HUBG, JBHT, HURC, IDXX, IIIN, TILE, IPI, KLAC, LHX, LH, LEG, LOW, MANH, MRO, MAS, MTDR, MRCY, META, MS, MUR, NOV, NFLX, NTAP, NWL, NEU, NOVT, NUS, NTNX, OXY, OGE, OLN, OMCL, ORCL, OMI, OXM, PTEN, PETS, PXD, PRU, RL, RMBS, REGN, RHI, RCKY, RES, ^GSPC, SBH, SCHW, SEIC, SCCO, SXI, SSYS, TDOC, TFX, TREX, TWLO, VLO, VRSN, VRTX, VMC, WERN, ZBRA, IYM, IYE, IEZ, IDU, IXC, IGE, IEO, EWA, EWK, EIS, EWU, IBB, PXJ, SSO, ROBO, XLB, XRT, XLU, USO, VAW. Click this link for details (pattern type, start and end dates).
For a list of small patterns (those a few days wide) click this link.
$ $ $
The following table shows where Fibonacci retrace values of the day's high-low range are plus pivot points, calculated on the Dow industrials, sorted by value. When several are near each other (small differences), the area might act as support or resistance.
-- Thomas Bulkowski
![]()
| © 2023 ThePatternSite.com Metric | Value | Diff | Close (within 10% of the high-low range for the day)? |
| Monthly S2 | 33,144.69 | ||
| Monthly S1 | 35,225.35 | 2,080.66 | |
| Weekly S2 | 35,845.19 | 619.84 | |
| Monthly Pivot | 36,286.48 | 441.29 | |
| Weekly S1 | 36,575.61 | 289.13 | |
| Weekly Pivot | 36,961.60 | 386.00 | |
| Daily S2 | 37,219.51 | 257.91 | |
| Daily S1 | 37,262.76 | 43.25 | |
| Low | 37,284.85 | 22.09 | |
| Close | 37,306.02 | 21.17 | |
| 61.8% Down from Intraday High | 37,326.34 | 20.32 | |
| Daily Pivot | 37,328.11 | 1.77 | Yes! The Daily Pivot is close to the 61.8% Down from Intraday High. |
| Open | 37,330.14 | 2.04 | Yes! The Open is close to the Daily Pivot. |
| 50% Down from Intraday High | 37,339.15 | 9.01 | Yes! The 50% Down from Intraday High is close to the Open. |
| 38.2% Down from Intraday High | 37,351.96 | 12.82 | |
| Daily R1 | 37,371.36 | 19.40 | |
| High | 37,393.45 | 22.09 | |
| Daily R2 | 37,436.71 | 43.26 | |
| Weekly R1 | 37,692.02 | 255.31 | |
| Weekly R2 | 38,078.01 | 386.00 | |
| Monthly R1 | 38,367.14 | 289.13 | |
| Monthly R2 | 39,428.27 | 1,061.12 |
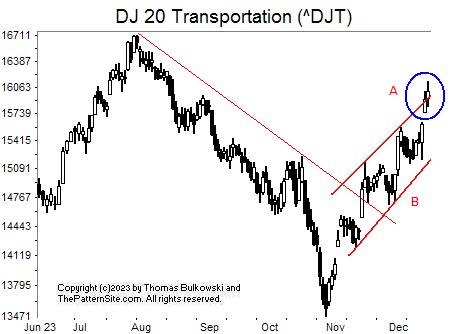
This is the Dow transports on the daily scale.
I drew a thin red line to show the transition from down to up. Then I added a channel, also in red, but using thicker lines (B).
Circled at A is what looks like a breakaway gap. It's too soon to tell if it's a breakaway or an exhaustion.
The CPI (chart pattern indicator) has made a dramatic drop to 30, bearish. It suggests the gap is an exhaustion and we'll see the markets tumble.
I think that's the right position, so be cautious here. Yes, I expect the markets to retrace their strong advance (the Dow industrials show the advance much better than the transports, starting from the October low). After such a big gain (from the FED meeting), after 7 to 10 days we'll see a retrace start. So next week should be an important turn.
![]()
The following is a brief review of how the markets performed over time. The numbers refer to the close-to-close move in the Dow industrials.
No options expire this week.
![]()
The following is based on an SFO article in December 2004 by John Seekinger, titled, "Take a two-dimensional approach." He offers these tips.
| Index | S2 | S1 | Pivot | R1 | R2 |
| Dow Industrials (^DJI): Daily | 36,993 | 37,149 | 37,248 | 37,405 | 37,504 |
| Weekly | 35,845 | 36,575 | 36,961 | 37,691 | 38,078 |
| Monthly | 33,144 | 35,225 | 36,286 | 38,367 | 39,428 |
| S&P500 (^GSPC): Daily | 4,696 | 4,707 | 4,716 | 4,728 | 4,737 |
| Weekly | 4,539 | 4,629 | 4,684 | 4,774 | 4,829 |
| Monthly | 4,272 | 4,496 | 4,617 | 4,841 | 4,962 |
| Nasdaq (^IXIC): Daily | 14,710 | 14,762 | 14,805 | 14,857 | 14,900 |
| Weekly | 14,134 | 14,474 | 14,665 | 15,005 | 15,196 |
| Monthly | 13,285 | 14,049 | 14,452 | 15,217 | 15,620 |
Here are the formulas:
![]()
Earnings season is over.
Mutual funds will begin dividend distributions and rebalancing their portfolios for the approaching year end (starts in late November).
Here's a symbol list of 162 chart and candlestick patterns (13 "investment grade" candle patterns) found in today's securities using my version of Patternz: MMM, ABM, ACN, ADTN, AFL, ATSG, ALRM, ALGT, AIG, AMN, AON, AGO, ADSK, ADP, AVNT, AXS, BIG, BIO, BFH, BCO, BRKR, CACI, CPB, CNC, CENX, CHS, CTAS, CNO, CNX, CL, ED, CXW, CCRN, CSGS, XRAY, DRQ, EXP, EMN, EBAY, WIRE, EFX, EL, EG, EXC, EXPI, EZPW, FIVN, FTNT, FWRD, FCX, FRD, GIS, GPRO, GGG, GES, THG, HAYN, HTLD, HSII, HNI, JBHT, ILMN, ITGR, IPI, KMT, KFRC, LHX, LZB, LH, LEG, LLY, RAMP, L, LOW, MHO, META, MLKN, MS, NWL, NKE, JWN, NOVT, NUS, NVDA, ORI, OMCL, OMI, OXM, PTEN, PETS, POR, PEG, DGX, RMBS, REGN, RGS, RHI, RCKY, ROG, RES, SBH, SEIC, SIGI, SLGN, SCCO, SWX, SPLK, SXI, SRDX, TECH, TDOC, TEVA, TTD, TJX, TSCO, TDG, TZOO, TREX, UHAL, UGI, UIS, UNM, VRSN, V, VC, VMC, WWW, WWD, ZBRA, IYK, FTEC, BOTZ, IHF, IXN, ILF, EWA, EWZ, EWC, EWH, EWM, TUR, IBB, ROBO, XRT, XLK, VAW. Click this link for details (pattern type, start and end dates).
For a list of small patterns (those a few days wide) click this link.
The below industries were the best (rank 1) or worst performing of those I follow.
|
-- Thomas Bulkowski
![]()
$ $ $
Here's a symbol list of 374 chart and candlestick patterns (13 "investment grade" candle patterns) found in today's securities using my version of Patternz: DDD, MMM, ABM, ACIW, AYI, ADTN, AEIS, AES, AFL, A, ALRM, ALB, AA, ALGT, AMZN, AEE, AXP, AFG, AIG, AMWD, ANIK, AON, APOG, ADM, ASH, AGO, ATO, ADSK, ADP, AVY, AVNT, AXS, AZTA, BMI, BCPC, BAX, BZH, BERY, BIG, BFH, BCO, BRKR, BLDR, CBT, CACI, CPB, CE, CNC, CNP, CENX, CRL, CVX, CHS, CINF, CTAS, CLNE, CNA, CNO, CGNX, CTSH, ED, CONN, CXW, GLW, CSGP, CROX, CTS, CMI, CW, XRAY, DVN, DFS, DSGR, ^DJT, DOV, BOOM, EXP, EMN, EME, WIRE, EPAM, EFX, EL, EG, EVH, EXC, EXPI, EXPD, XOM, EZPW, FICO, FARO, FDX, FE, FIVN, FLEX, FMC, FTNT, FTV, FNV, FCX, GIS, GNW, GFS, GMS, GS, GPRO, GGG, GFF, GES, HBI, HE, HAYN, HSII, HELE, HSIC, HD, DHI, HOV, JBHT, HUN, IEX, ITW, ILMN, IBP, PODD, TILE, IPI, NVTA, JBLU, KALU, KBH, KMT, KEYS, KFRC, KMB, KLAC, KSS, KLIC, LH, LAMR, LEN, LLY, LNC, L, LOW, LXU, MHO, MAN, MKTX, MRTN, MAS, MA, MTRN, MDC, MDT, MRCY, MU, MLKN, MS, MOS, MLI, MYGN, NBR, NFG, NJR, NWL, JWN, NWPX, NOVT, NUS, ORI, OLN, ASGN, ON, OTEX, OR, OMI, OXM, PANW, PKE, PATK, PDCO, PAYX, PCTY, PEN, PFE, PXD, PPG, PPL, PINC, PFG, PGR, PRU, PHM, PSTG, KWR, QCOM, DGX, RL, RMBS, RGS, RHI, ROK, ROP, RGLD, SBH, SAND, SCHW, SMG, SEE, SEIC, SIGI, SMTC, SCI, SHW, SLGN, SKX, SCCO, SWX, SPSC, SCS, SSYS, SRDX, TPR, TGT, TECH, TDOC, TFX, TPX, TDC, TER, TXN, TTD, TMO, TJX, TOL, TDG, TRV, TG, TREX, TWLO, UHAL, SLCA, UGI, UPS, VFC, VLO, MDRX, VRSN, V, VMC, WAT, WSO, WERN, WU, WLK, WEX, WPM, WSM, WSC, WWW, ZBRA, IYM, IAI, IYK, IYC, IYE, ITB, IHE, FXL, BOTZ, ICF, IYH, IAT, IYZ, IEV, IXC, MXI, SOXX, SLV, IGE, IYF, IHI, EWA, EWO, EWK, EWQ, EWG, EWM, EPP, EWY, EWP, EWD, EWT, EWU, IBB, DBA, PBE, PEJ, PHO, ROBO, XLY, XLF, XLV, XHB, XLI, XLB, XRT, SMH, VIS, VAW. Click this link for details (pattern type, start and end dates).
For a list of small patterns (those a few days wide) click this link.
$ $ $
You can find setups based on a Fibonacci retrace by clicking on the link.
The following patterns were found manually, not using Patternz. Mr. Bulkowski has excluded any securities he owns from appearing in the list. However, he may add any of the securities listed to his portfolio at any time, just as you can.
In the table below, the red and green colors are based on the historical breakout direction for the associated chart pattern. If a high and tight flag appears, the start and end dates highlight the flagpole only and not the flag.
For details about the chart patterns, click here.
-- Thomas Bulkowski
![]()
| Symbol | Chart Pattern | Bullish Bearish | Start | End | Industry |
| DDD | Flag, high and tight | 10/27/2023 | 12/14/2023 | Electronics | |
| ALRM | Ugly double bottom | 11/01/2023 | 11/30/2023 | Computer Software and Svcs | |
| ALB | Big W | 11/13/2023 | 12/05/2023 | Chemical (Diversified) | |
| AA | Double Bottom, Eve and Adam | 10/23/2023 | 12/12/2023 | Aerospace/Defense | |
| AMAT | Ugly double bottom | 10/31/2023 | 11/17/2023 | Semiconductor Cap Equip. | |
| ADM | Ugly double bottom | 10/25/2023 | 11/28/2023 | Food Processing | |
| ADSK | Pipe bottom | 11/20/2023 | 11/27/2023 | Computer Software and Svcs | |
| ADP | Ugly double bottom | 11/01/2023 | 11/30/2023 | IT Services | |
| AVA | Triangle, ascending | 11/03/2023 | 12/12/2023 | Electric Utility (West) | |
| BMI | Ugly double bottom | 10/23/2023 | 11/21/2023 | Precision Instrument | |
| BIG | Flag, high and tight | 11/10/2023 | 12/13/2023 | Retail Store | |
| BIIB | Double Bottom, Eve and Adam | 11/13/2023 | 11/28/2023 | Biotechnology | |
| CX | Triangle, ascending | 11/14/2023 | 12/12/2023 | Cement and Aggregates | |
| CNP | Rectangle top | 10/17/2023 | 11/27/2023 | Electric Utility (Central) | |
| CTAS | Three Rising Valleys | 09/27/2023 | 12/07/2023 | Industrial Services | |
| CTSH | Ugly double bottom | 11/02/2023 | 11/30/2023 | IT Services | |
| CL | Double Top, Eve and Adam | 12/04/2023 | 12/13/2023 | Household Products | |
| CMTL | Dead-cat bounce | 12/08/2023 | 12/13/2023 | Telecom. Equipment | |
| CTS | Ugly double bottom | 10/31/2023 | 11/09/2023 | Electronics | |
| CW | Three Rising Valleys | 10/04/2023 | 11/29/2023 | Machinery | |
| DSGR | Ugly double bottom | 11/08/2023 | 11/29/2023 | Metal Fabricating | |
| WIRE | Pipe bottom | 11/27/2023 | 12/04/2023 | Metals and Mining (Div.) | |
| EXPI | Pipe bottom | 11/06/2023 | 11/13/2023 | E-Commerce | |
| EZPW | Triple bottom | 09/25/2023 | 11/28/2023 | Financial Services | |
| FLEX | Head-and-shoulders bottom | 09/27/2023 | 12/05/2023 | Electronics | |
| FLS | Ugly double bottom | 10/25/2023 | 11/22/2023 | Machinery | |
| FMC | Triple bottom | 10/23/2023 | 11/10/2023 | Chemical (Basic) | |
| FTNT | Ugly double bottom | 11/03/2023 | 12/07/2023 | Computer Software and Svcs | |
| FCX | Ugly double bottom | 11/10/2023 | 12/07/2023 | Metals and Mining (Div.) | |
| GMS | Rounding bottom | 08/07/2023 | 12/13/2023 | Cement and Aggregates | |
| GES | Broadening top | 10/17/2023 | 11/22/2023 | Apparel | |
| HE | Ugly double bottom | 11/10/2023 | 11/30/2023 | Electric Utility (West) | |
| HUN | Ugly double bottom | 11/01/2023 | 11/28/2023 | Chemical (Specialty) | |
| INCY | Triangle, ascending | 10/31/2023 | 12/01/2023 | Drug | |
| IPAR | Triple bottom | 10/12/2023 | 11/29/2023 | Toiletries/Cosmetics | |
| IPI | Double Bottom, Adam and Adam | 11/10/2023 | 12/13/2023 | Chemical (Diversified) | |
| KLAC | Three Rising Valleys | 09/27/2023 | 12/05/2023 | Semiconductor Cap Equip. | |
| LANC | Triangle, symmetrical | 11/02/2023 | 12/12/2023 | Food Processing | |
| M | Flag, high and tight | 10/13/2023 | 12/11/2023 | Retail Store | |
| MA | Ugly double bottom | 10/27/2023 | 12/05/2023 | Financial Services | |
| MRCY | Pipe bottom | 11/06/2023 | 11/13/2023 | Computers and Peripherals | |
| NI | Three Rising Valleys | 10/03/2023 | 11/30/2023 | Electric Utility (Central) | |
| NWPX | Double Bottom, Eve and Adam | 11/08/2023 | 11/28/2023 | Building Materials | |
| OGE | Ugly double bottom | 10/03/2023 | 10/23/2023 | Electric Utility (Central) | |
| OXM | Pipe bottom | 11/27/2023 | 12/04/2023 | Apparel | |
| PTEN | Triangle, symmetrical | 11/08/2023 | 12/04/2023 | Oilfield Svcs/Equipment | |
| PG | Double Top, Eve and Adam | 11/14/2023 | 11/30/2023 | Household Products | |
| PGR | Broadening top | 11/24/2023 | 12/13/2023 | Insurance (Prop/Casualty) | |
| RGS | Dead-cat bounce | 12/14/2023 | 12/14/2023 | Toiletries/Cosmetics | |
| SCCO | Pipe bottom | 11/27/2023 | 12/04/2023 | Metals and Mining (Div.) | |
| SWX | Head-and-shoulders bottom | 10/06/2023 | 11/13/2023 | Natural Gas (Distributor) | |
| SXI | Double Bottom, Adam and Eve | 11/07/2023 | 11/30/2023 | Diversified Co. | |
| TXT | Triple bottom | 10/25/2023 | 11/29/2023 | Diversified Co. | |
| TTD | Ugly double bottom | 11/10/2023 | 12/04/2023 | Advertising | |
| UNM | Triangle, symmetrical | 11/02/2023 | 12/08/2023 | Insurance (Diversified) | |
| VECO | Scallop, ascending and inverted | 10/31/2023 | 12/05/2023 | Precision Instrument | |
| VEEV | Double Bottom, Adam and Adam | 11/10/2023 | 12/07/2023 | Healthcare Information | |
| MDRX | Triple top | 08/14/2023 | 10/11/2023 | Healthcare Information | |
| VMC | Ugly double bottom | 10/27/2023 | 11/20/2023 | Cement and Aggregates | |
| XLK | Ugly double bottom | 10/26/2023 | 12/04/2023 | IT Services | |
| MGK | Ugly double bottom | 10/26/2023 | 12/04/2023 | None | |
| VONG | Ugly double bottom | 10/26/2023 | 12/04/2023 | None |
![]()
Since I post this the night before, check how the futures are trading before market open. Large moves can affect the opening direction.
$ $ $
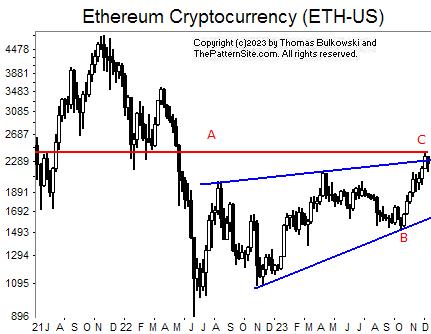
I show a picture of Ethereum on the weekly scale.
I drew the horizontal line A from today's price backward in time to the left. I wanted to see where overhead resistance lined up with today. There are some valleys back in 2022 that may cause the cryptocurrency to pause here. It's a rather loose looking area, so maybe ETH can push through.
I drew two more lines, blue ones this time. It forms a rising wedge which usually breaks out downward. This wedge has four touches (not including today) when I five is best. Together, the red and blue lines suggest ETH will struggle to rise, but I don't think the two are additive. Meaning the red and blue lines of weak resistance won't add up to a concrete ceiling.
However, the rise from B has been strong, a straight-line run, and the coin is overdue for a retrace. My guess is we'll see it drop.
$ $ $
Here's a symbol list of 186 chart and candlestick patterns (13 "investment grade" candle patterns) found in today's securities using my version of Patternz: MMM, ANF, ABM, AYI, ADTN, AMD, ALRM, ALB, ALKS, AEE, AXP, APOG, AAPL, ATR, ACGL, ADM, AWI, ATO, AVNT, AVA, AZTA, BALL, BBY, BIG, BKNG, BAH, BMY, BLDR, CBT, CAL, CLS, CX, CENX, CIEN, CINF, CSCO, CLF, CLX, CMCO, CXW, GLW, COST, CROX, CCRN, CCK, CMI, ^DJT, D, DOV, EXP, EBAY, EIX, WIRE, EG, EXPI, EZPW, FDS, FDX, FIS, FE, FIVN, FLS, FMC, FTNT, GME, GNW, GMS, GPRO, HBI, HLIT, HE, HSIC, HD, IDA, IEX, INFN, NSP, IPI, NVTA, KALU, KSS, LZB, LH, LAMR, LDOS, LNC, LMT, LPLA, MRTN, MAS, MTRN, MRK, MGEE, MYGN, NFG, NFLX, NJR, NWL, NEU, NKE, NWPX, NUS, NTNX, OGE, OXM, PKG, PKE, PCTY, PYPL, PFE, POR, PPG, PPL, PGR, RL, RJF, ROK, ROL, RGLD, SAIA, SAND, SEE, SRE, SCI, SMAR, SCCO, SPLK, SCS, SSYS, SRDX, TPR, TDOC, TKR, TJX, TG, SLCA, UIS, UPS, VFC, VRTX, VMC, WAT, WPM, WSC, XEL, ZBRA, IYM, IAI, IDU, QQQ, IYH, IAT, IYZ, IEV, EWA, EWQ, EWM, EPP, EZA, EWD, TUR, QLD, IBB, PBE, PEJ, XLV, XLB, XRT, VAW, VONG. Click this link for details (pattern type, start and end dates).
For a list of small patterns (those a few days wide) click this link.
$ $ $
The following table shows where Fibonacci retrace values of the day's high-low range are plus pivot points, calculated on the Nasdaq composite, sorted by value. When several are near each other (small differences), the area might act as support or resistance.
-- Thomas Bulkowski
![]()
| © 2023 ThePatternSite.com Metric | Value | Diff | Close (within 10% of the high-low range for the day)? |
| Monthly S2 | 13,210.49 | ||
| Monthly S1 | 13,972.23 | 761.73 | |
| Weekly S2 | 14,044.73 | 72.51 | |
| Monthly Pivot | 14,197.72 | 152.99 | |
| Weekly S1 | 14,389.35 | 191.62 | |
| Weekly Pivot | 14,403.13 | 13.79 | Yes! The Weekly Pivot is close to the Weekly S1. |
| Daily S2 | 14,438.98 | 35.85 | |
| Low | 14,517.52 | 78.54 | |
| Open | 14,555.68 | 38.16 | |
| Daily S1 | 14,586.47 | 30.79 | |
| 61.8% Down from Intraday High | 14,603.86 | 17.39 | Yes! The 61.8% Down from Intraday High is close to the Daily S1. |
| 50% Down from Intraday High | 14,630.54 | 26.67 | |
| 38.2% Down from Intraday High | 14,657.21 | 26.67 | |
| Daily Pivot | 14,665.01 | 7.80 | Yes! The Daily Pivot is close to the 38.2% Down from Intraday High. |
| Close | 14,733.96 | 68.95 | |
| High | 14,743.55 | 9.59 | Yes! The High is close to the Close. |
| Weekly R1 | 14,747.75 | 4.20 | Yes! The Weekly R1 is close to the High. |
| Weekly R2 | 14,761.53 | 13.79 | Yes! The Weekly R2 is close to the Weekly R1. |
| Daily R1 | 14,812.50 | 50.97 | |
| Daily R2 | 14,891.04 | 78.54 | |
| Monthly R1 | 14,959.46 | 68.42 | |
| Monthly R2 | 15,184.95 | 225.50 |
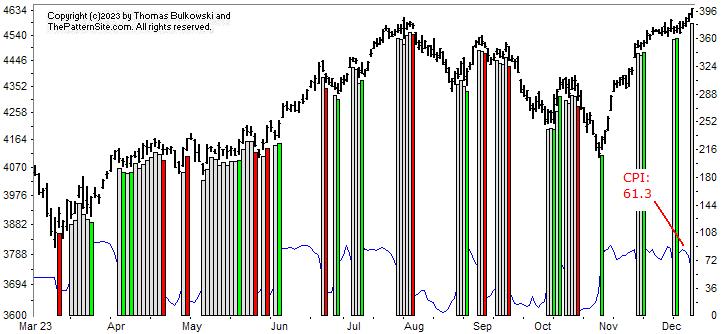
This is a picture of the chart pattern indicator on the daily scale. The indicator is the line chart below a chart of the S&P 500 composite.
The CPI is at 61.3, which is neutral, hence the vertical white bar on the far right of the chart.
Notice that the thin blue line has turned lower and has been trending down for almost 2 weeks now. That's a sign of weakness.
My expectations for tomorrow is that the FED will leave rates alone, but the market will drop. Not far, but you never know. If the FED raises rate, then it'll be a big drop. If they hint of further raises next year, then expect a big drop. If they drop rates, then look for a big move up in the markets. Anything other than those scenarios and you'll probably see a minor drop (less than 100 points).
The red line is the percentage of stocks at least 20% below their 1-year high (plotted upside down). The blue line is the average percentage drop of stocks below their 1-year high (plotted upside down).
On Tuesday, 34% of stocks in my database are in bear market territory (down at least 20% from their 1-year high).A week ago, it was 37%.The fewest was 26% on 07/31/2023.And the most was 57% on 12/19/2022.
The 518 stocks in my database are down an average of 16% from their yearly high.A week ago, the average was 17%.The peak was 14% on 07/31/2023.And the bottom was 27% on 12/19/2022.
This chart is bullish. We'll have to wait to see what the FED does and how the markets react to it.
$ $ $
Here's a symbol list of 149 chart and candlestick patterns (13 "investment grade" candle patterns) found in today's securities using my version of Patternz: MMM, AXDX, ALK, ALGT, APH, AVY, AVNT, BECN, BERY, BA, BCO, BG, CBT, CACI, CDNS, CHS, CIEN, CI, CINF, CLF, CGNX, GLW, CCRN, CTS, DSGR, BOOM, EXP, EMN, WIRE, EPAM, EVRG, EZPW, FIS, FIVN, FMC, GME, GNW, GILD, GFS, GMS, HL, HSII, HSIC, HSY, HNI, HD, HON, HUN, IDA, INCY, INFN, IPI, ISRG, KELYA, LH, LNC, LMT, LPLA, MHO, MANH, MAN, MCHX, MLM, MTDR, MDC, META, MGEE, MLKN, MOS, MUR, NFG, NTAP, NI, NUS, NVDA, OR, OXM, PATK, PDCO, PTEN, PNW, PLXS, PEG, QCOM, RL, RJF, ROK, SAIA, SAND, SEE, SRE, SCI, SKYW, SO, SCCO, SPLK, SCS, SSYS, TGT, TDOC, TEVA, TXN, TOL, TZOO, UIS, UPS, VMC, WRB, WLK, WPM, ITA, IYE, IHE, IHF, IYZ, IEV, SLV, IGE, IEO, EWK, EWQ, EWG, EWI, EWM, EZA, EWL, THD, PXJ, ROBO, XLE, GLD, XLB. Click this link for details (pattern type, start and end dates).
For a list of small patterns (those a few days wide) click this link.
-- Thomas Bulkowski
![]()
$ $ $
I show another slider trading quiz featuring Horn bottom.
$ $ $
Here's a symbol list of 123 chart and candlestick patterns (13 "investment grade" candle patterns) found in today's securities using my version of Patternz: MMM, ANF, AXDX, ADBE, AES, ALKS, ALL, AMED, AEO, APH, ANIK, APOG, ADSK, AZTA, BZH, BIIB, BKNG, BSX, CBT, CALM, CE, CNP, CDAY, CINF, CSCO, CMTL, GLW, COST, CR, CRH, CTS, DSGR, ^DJU, DOV, DUK, BOOM, EMN, EZPW, FDX, FIS, FIVN, FORM, FTNT, GME, GILD, GMS, GES, THG, HTLD, HNI, HD, HOV, HUBG, HUN, INCY, INFN, ITGR, IBKR, KSS, LH, LEN, LLY, LNC, L, M, MAN, MTRN, MDT, MU, MLKN, NEU, NEE, NKE, JWN, NUS, OMC, PANW, PTEN, PFE, QCOM, RL, RJF, REGN, ROK, RCKY, SMG, SRE, SCI, SWN, SR, SUM, TREX, UIS, VFC, VRTX, VMC, WMT, WSO, WERN, ITB, IDU, QTEC, IEV, SOXX, SLV, EWK, EWQ, EWJ, EWT, TUR, GLD, XLU, UNG, SMH. Click this link for details (pattern type, start and end dates).
For a list of small patterns (those a few days wide) click this link.
$ $ $
The following table shows where Fibonacci retrace values of the day's high-low range are plus pivot points, calculated on the Dow industrials, sorted by value. When several are near each other (small differences), the area might act as support or resistance.
-- Thomas Bulkowski
![]()
| © 2023 ThePatternSite.com Metric | Value | Diff | Close (within 10% of the high-low range for the day)? |
| Monthly S2 | 33,083.87 | ||
| Monthly S1 | 34,744.40 | 1,660.53 | |
| Monthly Pivot | 35,520.30 | 775.90 | |
| Weekly S2 | 35,951.98 | 431.68 | |
| Daily S2 | 36,165.78 | 213.80 | |
| Weekly S1 | 36,178.45 | 12.68 | Yes! The Weekly S1 is close to the Daily S2. |
| Low | 36,231.19 | 52.74 | |
| Weekly Pivot | 36,237.33 | 6.14 | Yes! The Weekly Pivot is close to the Low. |
| Open | 36,254.33 | 17.00 | Yes! The Open is close to the Weekly Pivot. |
| Daily S1 | 36,285.35 | 31.02 | |
| 61.8% Down from Intraday High | 36,301.86 | 16.50 | Yes! The 61.8% Down from Intraday High is close to the Daily S1. |
| 50% Down from Intraday High | 36,323.68 | 21.83 | |
| 38.2% Down from Intraday High | 36,345.52 | 21.83 | |
| Daily Pivot | 36,350.77 | 5.25 | Yes! The Daily Pivot is close to the 38.2% Down from Intraday High. |
| Close | 36,404.93 | 54.16 | |
| High | 36,416.18 | 11.25 | Yes! The High is close to the Close. |
| Weekly R1 | 36,463.80 | 47.63 | |
| Daily R1 | 36,470.34 | 6.54 | Yes! The Daily R1 is close to the Weekly R1. |
| Weekly R2 | 36,522.68 | 52.33 | |
| Daily R2 | 36,535.76 | 13.08 | Yes! The Daily R2 is close to the Weekly R2. |
| Monthly R1 | 37,180.83 | 645.07 | |
| Monthly R2 | 37,956.73 | 775.90 |
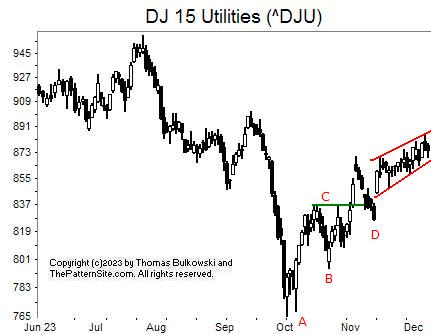
I show the Dow utilities on the daily scale.
The most important feature of this chart is the red, up-sloping channel. I often cite the trendline nearest price as the one where price will bounce off it. In this case, the channel is too narrow to make a guess. Maybe that means price will continue rising.
AB is what I call an ugly double bottom. A double bottom has two bottoms at or near the same price. In the ugly version, the second (right) bottom is significantly higher than the left. When it confirms by closing above C, price climbs.
In this example, we see the index throwback to the breakout price. To me, this suggests that price will recover (move higher) in the coming days. Indeed, we see that happen with the rising channel.
![]()
The following is a brief review of how the markets performed over time. The numbers refer to the close-to-close move in the Dow industrials.
Many options expire this week, so traders will be looking to close out their positions, and that suggests increased volatility (large daily price swings).
![]()
The following is based on an SFO article in December 2004 by John Seekinger, titled, "Take a two-dimensional approach." He offers these tips.
| Index | S2 | S1 | Pivot | R1 | R2 |
| Dow Industrials (^DJI): Daily | 35,967 | 36,108 | 36,202 | 36,342 | 36,436 |
| Weekly | 35,900 | 36,074 | 36,185 | 36,359 | 36,470 |
| Monthly | 33,032 | 34,640 | 35,468 | 37,076 | 37,904 |
| S&P500 (^GSPC): Daily | 4,561 | 4,583 | 4,596 | 4,618 | 4,631 |
| Weekly | 4,524 | 4,564 | 4,587 | 4,627 | 4,649 |
| Monthly | 4,254 | 4,429 | 4,519 | 4,694 | 4,784 |
| Nasdaq (^IXIC): Daily | 14,210 | 14,307 | 14,362 | 14,459 | 14,514 |
| Weekly | 13,935 | 14,169 | 14,293 | 14,528 | 14,652 |
| Monthly | 13,100 | 13,752 | 14,088 | 14,739 | 15,075 |
Here are the formulas:
![]()
Earnings season is over.
Mutual funds will begin dividend distributions and rebalancing their portfolios for the approaching year end (starts in late November).
Here's a symbol list of 110 chart and candlestick patterns (13 "investment grade" candle patterns) found in today's securities using my version of Patternz: MMM, AXDX, ACN, AFL, ALB, ALKS, DOX, AEO, AMWD, AME, ANET, AWI, ADSK, AVNT, BALL, BZH, BKNG, CALM, CHKP, CIEN, CI, CLX, CNA, CMTL, GLW, CTS, CW, ^DJI, BOOM, EIX, EFX, EZPW, FFIV, FDX, FIS, FIVN, FLS, FORM, FTV, FDP, GME, GE, GIS, GMS, GES, HOV, HUN, IEX, INFN, IBKR, KMT, LHX, LZB, LH, LAMR, MTSI, M, MRTN, MLM, MTRN, MCO, JWN, NWPX, ON, PRFT, PPG, PFG, PSTG, RJF, RTX, ROP, RES, SMG, SKYW, SMAR, SPSC, SCS, SRDX, TFX, UIS, VECO, MDRX, VRTX, WMT, WSO, WU, ZBRA, ITA, DDM, FXI, IHF, IEV, ILF, SLV, EWK, EWZ, EWQ, EWM, THD, DBA, XLE, UNG. Click this link for details (pattern type, start and end dates).
For a list of small patterns (those a few days wide) click this link.
The below industries were the best (rank 1) or worst performing of those I follow.
|
-- Thomas Bulkowski
![]()
$ $ $
Here's a symbol list of 98 chart and candlestick patterns (13 "investment grade" candle patterns) found in today's securities using my version of Patternz: ABT, ACIW, AMD, AES, ALKS, AEE, AEO, AMAT, ATR, ACGL, AIZ, ADSK, AXS, BSET, BZH, BKNG, BFH, CALM, CIEN, CSCO, CGNX, CMCO, COP, GLW, COTY, DECK, FANG, BOOM, ELV, EMR, EL, XOM, FIS, FIVN, FRD, GME, GILD, GMS, GES, HIG, HOV, HWM, IPG, JBLU, KEYS, LHX, LZB, LH, LRCX, M, MANH, MTRN, NTAP, NJR, NUS, ON, OMI, PTEN, PRU, RL, RRC, RTX, RCKY, SRE, SMTC, SCI, LUV, SWN, SPSC, SXI, SUM, TPR, TGT, TFX, TDC, TXT, TKR, RIG, TRV, TREX, UHAL, UIS, WMT, WMB, WOLF, XEL, IXC, MXI, IEO, EWT, TUR, XRT, USO. Click this link for details (pattern type, start and end dates).
For a list of small patterns (those a few days wide) click this link.
$ $ $
You can find setups based on a Fibonacci retrace by clicking on the link.
The following patterns were found manually, not using Patternz. Mr. Bulkowski has excluded any securities he owns from appearing in the list. However, he may add any of the securities listed to his portfolio at any time, just as you can.
In the table below, the red and green colors are based on the historical breakout direction for the associated chart pattern. If a high and tight flag appears, the start and end dates highlight the flagpole only and not the flag.
For details about the chart patterns, click here.
-- Thomas Bulkowski
![]()
| Symbol | Chart Pattern | Bullish Bearish | Start | End | Industry |
| MMM | Ugly double bottom | 10/23/2023 | 11/21/2023 | Diversified Co. | |
| ABT | Triangle, symmetrical | 10/10/2023 | 11/10/2023 | Medical Supplies | |
| AA | Ugly double bottom | 10/23/2023 | 11/10/2023 | Aerospace/Defense | |
| ALKS | Horn bottom | 11/13/2023 | 11/27/2023 | Drug | |
| ALGT | Pipe bottom | 11/06/2023 | 11/13/2023 | Air Transport | |
| AEO | Pipe bottom | 11/20/2023 | 11/27/2023 | Apparel | |
| AMWD | Ugly double bottom | 10/27/2023 | 11/30/2023 | Building Materials | |
| AAPL | Ugly double bottom | 10/26/2023 | 12/04/2023 | Computers and Peripherals | |
| ACGL | Head-and-shoulders top | 10/18/2023 | 11/27/2023 | Insurance (Prop/Casualty) | |
| BAX | Diamond top | 11/28/2023 | 12/07/2023 | Medical Supplies | |
| BBY | Double Bottom, Adam and Adam | 11/10/2023 | 11/21/2023 | Retail (Special Lines) | |
| BIG | Ugly double bottom | 11/10/2023 | 11/21/2023 | Retail Store | |
| BKNG | Ugly double bottom | 10/26/2023 | 11/30/2023 | Internet | |
| BOOT | Pipe bottom | 10/23/2023 | 10/30/2023 | Shoe | |
| BFH | Double Bottom, Adam and Adam | 11/01/2023 | 11/16/2023 | Information Services | |
| BG | Double Bottom, Adam and Adam | 10/12/2023 | 10/24/2023 | Food Processing | |
| CALM | Pipe bottom | 11/20/2023 | 11/27/2023 | Food Processing | |
| CPB | Head-and-shoulders top | 10/26/2023 | 11/17/2023 | Food Processing | |
| CMCO | Ugly double bottom | 10/31/2023 | 11/22/2023 | Machinery | |
| CRH | Ugly double bottom | 10/27/2023 | 11/20/2023 | Cement and Aggregates | |
| EMR | Ugly double bottom | 11/07/2023 | 11/28/2023 | Computers and Peripherals | |
| EXPD | Ugly double bottom | 11/07/2023 | 11/27/2023 | Air Transport | |
| FTV | Ugly double bottom | 10/25/2023 | 11/27/2023 | Industrial Services | |
| FCX | Triple bottom | 10/23/2023 | 11/10/2023 | Metals and Mining (Div.) | |
| GME | Horn bottom | 11/13/2023 | 11/27/2023 | Retail (Special Lines) | |
| GPN | Pipe bottom | 10/23/2023 | 10/30/2023 | Computer Software and Svcs | |
| HTLD | Ugly double bottom | 11/01/2023 | 11/21/2023 | Trucking/Transp. Leasing | |
| HSIC | Ugly double bottom | 11/02/2023 | 11/30/2023 | Medical Supplies | |
| HOV | Flag, high and tight | 10/27/2023 | 12/07/2023 | Homebuilding | |
| IPI | Pipe bottom | 11/06/2023 | 11/13/2023 | Chemical (Diversified) | |
| JNJ | Double Bottom, Adam and Adam | 10/27/2023 | 11/10/2023 | Medical Supplies | |
| LEG | Triple bottom | 11/01/2023 | 11/28/2023 | Furn/Home Furnishings | |
| MGY | Triple top | 09/06/2023 | 10/17/2023 | Petroleum (Producing) | |
| NFG | Triangle, descending | 11/03/2023 | 12/07/2023 | Natural Gas (Diversified) | |
| NOV | Triangle, descending | 10/18/2023 | 12/07/2023 | Oilfield Svcs/Equipment | |
| NJR | Triangle, symmetrical | 10/18/2023 | 11/30/2023 | Natural Gas (Distributor) | |
| JWN | Pipe bottom | 11/06/2023 | 11/13/2023 | Retail Store | |
| NOVT | Pipe bottom | 11/06/2023 | 11/13/2023 | Precision Instrument | |
| OMCL | Ugly double bottom | 11/06/2023 | 11/21/2023 | Healthcare Information | |
| OUT | Broadening top | 11/15/2023 | 12/06/2023 | Advertising | |
| PKG | Ugly double bottom | 10/23/2023 | 11/13/2023 | Packaging and Container | |
| PYPL | Ugly double bottom | 10/27/2023 | 11/21/2023 | Financial Services | |
| RRC | Pipe top | 10/30/2023 | 11/06/2023 | Petroleum (Producing) | |
| SCHW | Ugly double bottom | 10/25/2023 | 11/10/2023 | Securities Brokerage | |
| SEIC | Ugly double bottom | 10/26/2023 | 11/28/2023 | IT Services | |
| SCI | Ugly double bottom | 11/01/2023 | 11/10/2023 | Industrial Services | |
| SLGN | Head-and-shoulders bottom | 10/13/2023 | 11/13/2023 | Packaging and Container | |
| SSYS | Big W | 11/01/2023 | 11/17/2023 | Electronics | |
| TPX | Ugly double bottom | 11/10/2023 | 11/28/2023 | Furn/Home Furnishings | |
| TEVA | Ugly double bottom | 10/23/2023 | 11/10/2023 | Drug | |
| VECO | Pipe top | 11/20/2023 | 11/27/2023 | Precision Instrument | |
| WLK | Ugly double bottom | 10/25/2023 | 11/28/2023 | Chemical (Basic) | |
| WSC | Ugly double bottom | 11/02/2023 | 11/27/2023 | Industrial Services | |
| WWD | Ugly double bottom | 10/27/2023 | 11/17/2023 | Precision Instrument |
![]()
Since I post this the night before, check how the futures are trading before market open. Large moves can affect the opening direction.
$ $ $
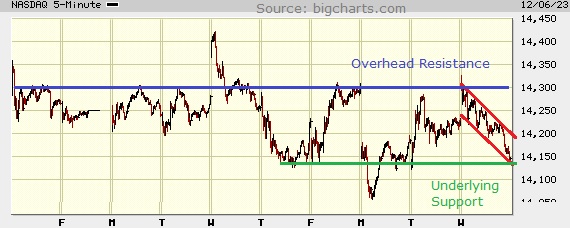
I show a picture of the Nasdaq composite on the 5-minute scale.
I looked at the peaks and drew a blue line, which marks overhead resistance. The index can blow threw it, of course, or it can bounce off it and head lower like you see in the past.
Underlying support appears in green. I connected common valleys and sliced through the dip on Monday. Notice how the current price touches the green support line. That suggests the index will bounce higher tomorrow (Thursday). That's what I think will happen. Price might race to the top of the red channel (or it could continued to drop below the green support line).
It's interesting that price spiked above the blue line on Wednesday and below the green line on Monday.
$ $ $
Here's a symbol list of 166 chart and candlestick patterns (13 "investment grade" candle patterns) found in today's securities using my version of Patternz: DDD, MMM, ANF, ADBE, AMD, AES, AFL, AKAM, ALRM, AA, ALKS, AYX, AEO, AIG, AMWD, ANIK, ACGL, ANET, ADSK, AXS, BZH, BMRN, BOOT, BFH, CBT, CDNS, CALM, CPB, CLS, CI, CSCO, CNX, CGNX, CL, CAG, CONN, COP, COST, CR, FANG, DFS, DSGR, ELV, EOG, XOM, EZPW, FICO, FAST, FDX, FIS, FIVN, FTNT, FCX, GME, GIS, GMS, GES, HIG, HD, HON, DHI, INFN, IBP, ITGR, INTC, IPAR, JKHY, KBH, K, KLAC, LH, LRCX, LEG, LEN, RAMP, LMT, LOW, LPLA, MTSI, M, MANH, MAS, MTDR, MTRN, MU, NOV, NFLX, NTAP, NJR, NKE, NWPX, ON, OTEX, PTEN, PYPL, PLXS, PG, PHM, QCOM, RMBS, RRC, REGN, ROG, RGLD, ^GSPC, CRM, SEE, SHW, STR, SKX, SKYW, SCCO, LUV, SWN, SPSC, SRDX, TDC, TXN, TOL, RIG, TRV, SLCA, UIS, WEX, XEL, IYM, ITB, DDM, FDN, QTEC, FXL, BOTZ, ICF, IEV, IGV, IXC, SOXX, IEO, EWO, EWK, EIS, EWI, EWY, EWD, PXJ, SSO, XHB, XLB, SPY, USO, SMH, VONG. Click this link for details (pattern type, start and end dates).
For a list of small patterns (those a few days wide) click this link.
$ $ $
The following table shows where Fibonacci retrace values of the day's high-low range are plus pivot points, calculated on the Nasdaq composite, sorted by value. When several are near each other (small differences), the area might act as support or resistance.
-- Thomas Bulkowski
![]()
| © 2023 ThePatternSite.com Metric | Value | Diff | Close (within 10% of the high-low range for the day)? |
| Monthly S2 | 11,900.85 | ||
| Monthly S1 | 13,023.78 | 1,122.93 | |
| Monthly Pivot | 13,723.50 | 699.72 | |
| Weekly S2 | 13,936.16 | 212.66 | |
| Daily S2 | 14,015.16 | 79.01 | |
| Weekly S1 | 14,041.43 | 26.27 | |
| Daily S1 | 14,080.94 | 39.50 | |
| Low | 14,138.51 | 57.57 | |
| Close | 14,146.71 | 8.20 | Yes! The Close is close to the Low. |
| Daily Pivot | 14,204.28 | 57.57 | |
| 61.8% Down from Intraday High | 14,210.75 | 6.47 | Yes! The 61.8% Down from Intraday High is close to the Daily Pivot. |
| Weekly Pivot | 14,232.33 | 21.57 | |
| 50% Down from Intraday High | 14,233.07 | 0.74 | Yes! The 50% Down from Intraday High is close to the Weekly Pivot. |
| 38.2% Down from Intraday High | 14,255.39 | 22.32 | |
| Daily R1 | 14,270.06 | 14.67 | Yes! The Daily R1 is close to the 38.2% Down from Intraday High. |
| Open | 14,325.62 | 55.56 | |
| High | 14,327.63 | 2.01 | Yes! The High is close to the Open. |
| Weekly R1 | 14,337.60 | 9.97 | Yes! The Weekly R1 is close to the High. |
| Daily R2 | 14,393.40 | 55.80 | |
| Weekly R2 | 14,528.50 | 135.09 | |
| Monthly R1 | 14,846.43 | 317.93 | |
| Monthly R2 | 15,546.15 | 699.72 |
This is a picture of the chart pattern indicator on the daily scale. The indicator is the line chart below a chart of the S&P 500 composite.
The CPI has turned bearish, suggesting the index is going to retrace a portion of its gains. I've been expecting this for a few weeks now.
Keep in mind that if the index were to make a big move higher, the bearish signal could disappear. The signal can change for up to a week.
Perhaps the markets are waiting for the FED to meet next week (Dec 12-13). Markets expect no increase in rates, but if they do raise rates, then look out below. If they don't raise rates, the markets could still drop, especially if the FED hints of another rate rise next year.
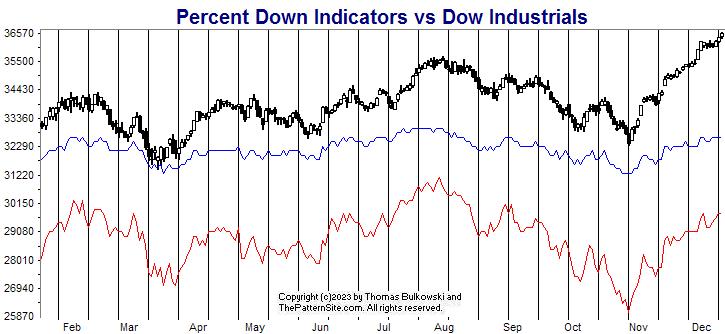
The red line is the percentage of stocks at least 20% below their 1-year high (plotted upside down). The blue line is the average percentage drop of stocks below their 1-year high (plotted upside down).
On Tuesday, 37% of stocks in my database are in bear market territory (down at least 20% from their 1-year high).A week ago, it was 38%.The fewest was 26% on 07/31/2023.And the most was 57% on 12/19/2022.
The 518 stocks in my database are down an average of 17% from their yearly high.A week ago, the average was 19%.The peak was 14% on 07/31/2023.And the bottom was 27% on 12/19/2022.
Both the red and blue lines show improvement from a week ago. Notice how the index has made a new high (on the chart) but the red and blue lines have not risen above the top of the July peak.
It's not divergence but it's weird. It makes me wonder if the market breath is as wide as one might expect.
The prior chart is bearish and this one is bullish but it's a weak bull. I think the downtrend will continue.
$ $ $
I released version 8.0.0.4 of Patternz today. It has more bug fixes.
$ $ $
Here's a symbol list of 128 chart and candlestick patterns (13 "investment grade" candle patterns) found in today's securities using my version of Patternz: ALB, ALKS, AMED, AEE, AEO, AEP, AME, APA, AAPL, ARCB, ACGL, ADSK, AVA, BALL, BZH, BKNG, BLDR, CACI, CALM, CAL, CPB, CHS, CI, CINF, CNX, CL, CMCO, COP, CR, CTS, DVN, FANG, DSGR, DTE, BOOM, EME, EOG, XOM, EZPW, FIS, FIVN, FLEX, FWRD, FNV, FDP, GME, GFS, GES, HSII, HSIC, HURC, NSP, ITGR, KALU, KMT, KFRC, KMB, KSS, LH, M, MCHX, MKTX, MRTN, MTDR, MTRN, MTRX, NBR, NFG, NOV, NEE, NKE, NOC, NWPX, OXY, ASGN, OR, OXM, PKE, PTEN, PLXS, PPL, PG, DGX, RRC, RHI, ROG, RES, SIGI, SRE, SHOP, SLGN, STR, SO, SWN, SPLK, TDY, TEVA, TJX, TG, SLCA, VECO, XEL, FTEC, FXI, SLV, EWK, EWH, EIS, PXJ, XLK, XLU, USO, MGK, VONG. Click this link for details (pattern type, start and end dates).
For a list of small patterns (those a few days wide) click this link.
-- Thomas Bulkowski
![]()
$ $ $
I show another slider trading quiz featuring broadening tops.
$ $ $
Here's a symbol list of 106 chart and candlestick patterns (13 "investment grade" candle patterns) found in today's securities using my version of Patternz: MMM, ALRM, ALKS, ALGT, ACGL, AWI, ATO, AVA, BCPC, BALL, BIG, BIIB, BOOT, BAH, BSX, BFH, BLDR, CALM, CHKP, CINF, CL, CAG, GLW, CMI, WIRE, EXPD, EZPW, FAST, FDX, FIS, FIVN, FNV, FDP, GFS, GOOGL, HIG, HE, HAYN, HON, HUN, IDXX, INCY, INTC, IBKR, NVTA, JBLU, KMT, KFRC, KMB, KSS, LH, LDOS, LLY, RAMP, L, M, MCHX, MTRN, MRK, MSFT, MLI, NFLX, NJR, NKE, NI, NWPX, NUS, NVDA, OXY, OMCL, ASGN, PCTY, PETS, PLXS, PPL, PRU, QCOM, DGX, RRC, ROK, SAIC, SWX, TFX, TEVA, TG, UIS, VECO, VRTX, WEX, XEL, IHE, FXI, IXC, EWH, EWP, TUR, XHB, UNG. Click this link for details (pattern type, start and end dates).
For a list of small patterns (those a few days wide) click this link.
$ $ $
The following table shows where Fibonacci retrace values of the day's high-low range are plus pivot points, calculated on the Dow industrials, sorted by value. When several are near each other (small differences), the area might act as support or resistance.
-- Thomas Bulkowski
![]()
| © 2023 ThePatternSite.com Metric | Value | Diff | Close (within 10% of the high-low range for the day)? |
| Monthly S2 | 30,994.51 | ||
| Monthly S1 | 33,599.48 | 2,604.96 | |
| Monthly Pivot | 34,932.16 | 1,332.69 | |
| Weekly S2 | 34,932.34 | 0.18 | Yes! The Weekly S2 is close to the Monthly Pivot. |
| Weekly S1 | 35,568.39 | 636.05 | |
| Weekly Pivot | 35,916.62 | 348.23 | |
| Daily S2 | 35,948.95 | 32.32 | |
| Low | 36,029.69 | 80.75 | |
| Daily S1 | 36,076.70 | 47.00 | |
| Open | 36,089.38 | 12.68 | Yes! The Open is close to the Daily S1. |
| 61.8% Down from Intraday High | 36,109.33 | 19.95 | Yes! The 61.8% Down from Intraday High is close to the Open. |
| 50% Down from Intraday High | 36,133.93 | 24.60 | |
| Daily Pivot | 36,157.44 | 23.50 | |
| 38.2% Down from Intraday High | 36,158.54 | 1.10 | Yes! The 38.2% Down from Intraday High is close to the Daily Pivot. |
| Close | 36,204.44 | 45.91 | |
| High | 36,238.18 | 33.74 | |
| Daily R1 | 36,285.18 | 47.00 | |
| Daily R2 | 36,365.93 | 80.74 | |
| Weekly R1 | 36,552.67 | 186.75 | |
| Weekly R2 | 36,900.90 | 348.23 | |
| Monthly R1 | 37,537.13 | 636.23 | |
| Monthly R2 | 38,869.81 | 1,332.69 |
Here's the updated 2023 forecast, presented in slider format.
The November forecast sent you to the October one. Oops. Here's the corrected link: November 2023 forecast
$ $ $
I'll be releasing another version of Patternz (8.0.0.4) soon to correct a few bugs.
$ $ $
Here's a symbol list of 128 chart and candlestick patterns (13 "investment grade" candle patterns) found in today's securities using my version of Patternz: DDD, ALRM, AMZN, APH, ACGL, ASH, AIZ, BALL, BIG, BA, BKNG, BMY, BBW, CDNS, CAL, CHD, CNX, CL, CMTL, CONN, CXW, CSGS, CTS, CW, XRAY, DDS, DFS, ^DJI, DTE, EPAM, EG, EXC, EXPD, FICO, FARO, FAST, FDX, FIS, FLEX, FTNT, GME, GNW, GMS, GOOGL, GFF, HBI, HAYN, HP, INFN, IBP, JKHY, KBH, K, KEYS, KMB, KSS, LZB, M, MANH, MKTX, MRTN, MLM, MTRN, MTRX, MGEE, MCO, NFLX, NTNX, OXY, OMI, PDCO, PEN, PETS, PLXS, PG, QTWO, QCOM, RMBS, RRC, RGS, RLI, ROK, RES, CRM, SMG, SIGI, SHW, STR, SWX, SWN, SXI, SNPS, TDOC, TFX, TER, TKR, TZOO, TG, TWLO, VC, WMT, WU, WPM, WMB, WWD, DDM, QTEC, FXL, FXI, BOTZ, IXC, EWK, EWH, EWW, THD, TUR, DBA, PBE, PJP, USO. Click this link for details (pattern type, start and end dates).
For a list of small patterns (those a few days wide) click this link.
-- Thomas Bulkowski
![]()
Support this site! Clicking any of the books (below) takes you to
Amazon.com If you buy ANYTHING while there, they pay for the referral.
Legal notice for paid links: "As an Amazon Associate I earn from qualifying purchases."
|
My Stock Market Books
|
My Novels
Orb Foresight Rewrite Coming!
|